PROTECTED SOURCE SCRIPT
Stablecoin Ratio with TPI Score
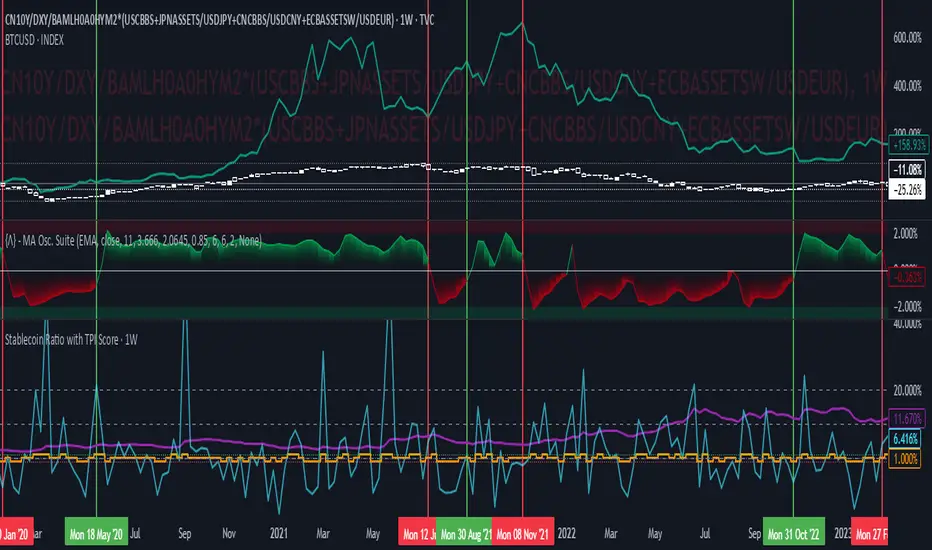
The script measures the stablecoin ratio (total stablecoin market cap divided by total crypto market cap, times 100) and its weekly change. Stablecoins (e.g., USDT, USDC) are a key gateway for capital entering or exiting the crypto ecosystem.
A rising ratio suggests more capital is parked in stablecoins (potential buying power), while a falling ratio indicates capital leaving (selling or withdrawal).
In a macro analysis, this is critical—it reflects the availability of liquid funds that could fuel price movements.
In macroeconomics, liquidity is a driver of asset prices.
In crypto, stablecoins represent sidelined capital ready to deploy.
How does it work?
Formula: (total_stablecoin_mcap / total_crypto_mcap) * 100.
Example: If stablecoins = $235B and total market cap = $2.5T, ratio = 9.4%.
Plotted as a red line in the oscillator pane, showing the percentage of the market held in stablecoins.
Calculates the percentage change in the ratio from the previous week:
(current_ratio - previous_ratio) / previous_ratio * 100.
Example: Ratio goes from 9% to 10% = +11.11% change.
*TPI Score Assignment:
+1 (Bullish): If the ratio increases by more than 5% week-over-week.
-1 (Bearish): If the ratio decreases by more than 5% week-over-week.
0 (Neutral): If the change is between -5% and +5%.
Plotted as orange step line bars in the oscillator pane, snapping to +1, 0, or -1.
A rising ratio suggests more capital is parked in stablecoins (potential buying power), while a falling ratio indicates capital leaving (selling or withdrawal).
In a macro analysis, this is critical—it reflects the availability of liquid funds that could fuel price movements.
In macroeconomics, liquidity is a driver of asset prices.
In crypto, stablecoins represent sidelined capital ready to deploy.
How does it work?
- Stablecoin Ratio:
Formula: (total_stablecoin_mcap / total_crypto_mcap) * 100.
Example: If stablecoins = $235B and total market cap = $2.5T, ratio = 9.4%.
Plotted as a red line in the oscillator pane, showing the percentage of the market held in stablecoins.
- Weekly Change:
Calculates the percentage change in the ratio from the previous week:
(current_ratio - previous_ratio) / previous_ratio * 100.
Example: Ratio goes from 9% to 10% = +11.11% change.
*TPI Score Assignment:
+1 (Bullish): If the ratio increases by more than 5% week-over-week.
-1 (Bearish): If the ratio decreases by more than 5% week-over-week.
0 (Neutral): If the change is between -5% and +5%.
Plotted as orange step line bars in the oscillator pane, snapping to +1, 0, or -1.
보호된 스크립트입니다
이 스크립트는 비공개 소스로 게시됩니다. 하지만 이를 자유롭게 제한 없이 사용할 수 있습니다 – 자세한 내용은 여기에서 확인하세요.
면책사항
해당 정보와 게시물은 금융, 투자, 트레이딩 또는 기타 유형의 조언이나 권장 사항으로 간주되지 않으며, 트레이딩뷰에서 제공하거나 보증하는 것이 아닙니다. 자세한 내용은 이용 약관을 참조하세요.
면책사항
해당 정보와 게시물은 금융, 투자, 트레이딩 또는 기타 유형의 조언이나 권장 사항으로 간주되지 않으며, 트레이딩뷰에서 제공하거나 보증하는 것이 아닙니다. 자세한 내용은 이용 약관을 참조하세요.