OPEN-SOURCE SCRIPT
Large Body Candle Indicator
Functionality
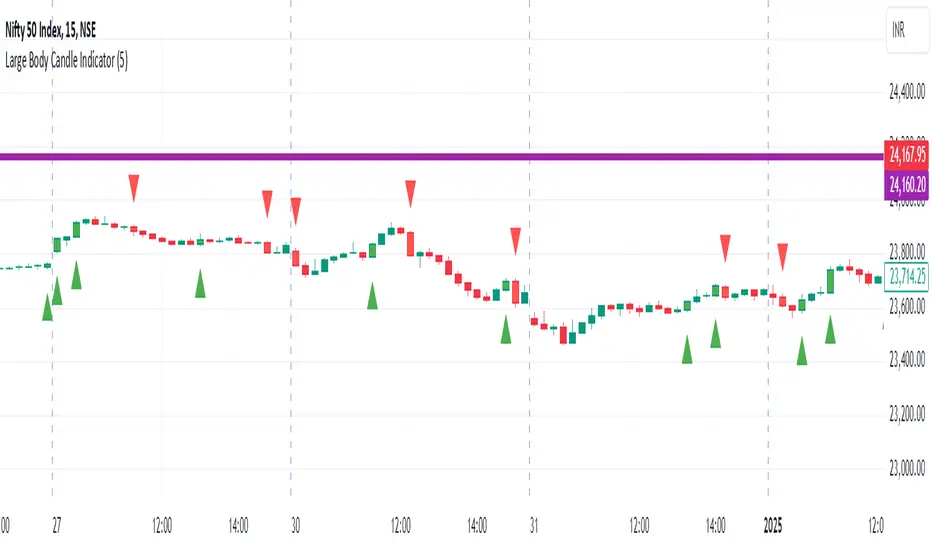
Comparison: The indicator compares the body size of the current candle to the maximum body size of the previous 5 candles.
Bullish Candles: When a bullish candle (close > open) has a larger body than the previous 5 candles:
A green triangle is plotted below the candle
The candle is colored green
Bearish Candles: When a bearish candle (close < open) has a larger body than the previous 5
candles:
A red triangle is plotted above the candle
The candle is colored red
Key Components
Lookback Period: Default set to 5 candles, but can be adjusted by the user.
Body Size Calculation: Calculated as the absolute difference between the open and close prices.
Maximum Previous Body Size: Determined by comparing the body sizes of the previous 5 candles.
Candle Classification: Candles are classified as bullish or bearish based on the relationship between open and close prices.
Visual Indicators:
Shape plotting for triangles
Bar coloring for highlighted candles
User Customization
Users can adjust the lookback period through the indicator settings, allowing for flexibility in identifying significant candles based on recent price action.
Use Cases
Identifying potential breakout candles
Spotting significant price movements
Enhancing visual analysis of price action
Supporting decision-making in trading strategies
Limitations
The indicator does not predict future price movements
It's based solely on recent price action and doesn't consider other technical or fundamental factors
Conclusion
The Large Body Candle Indicator provides a simple yet effective way to visually identify candles that show significant price movement relative to recent price action. It can be a valuable tool when used in conjunction with other technical analysis methods.
오픈 소스 스크립트
트레이딩뷰의 진정한 정신에 따라, 이 스크립트의 작성자는 이를 오픈소스로 공개하여 트레이더들이 기능을 검토하고 검증할 수 있도록 했습니다. 작성자에게 찬사를 보냅니다! 이 코드는 무료로 사용할 수 있지만, 코드를 재게시하는 경우 하우스 룰이 적용된다는 점을 기억하세요.
면책사항
해당 정보와 게시물은 금융, 투자, 트레이딩 또는 기타 유형의 조언이나 권장 사항으로 간주되지 않으며, 트레이딩뷰에서 제공하거나 보증하는 것이 아닙니다. 자세한 내용은 이용 약관을 참조하세요.
오픈 소스 스크립트
트레이딩뷰의 진정한 정신에 따라, 이 스크립트의 작성자는 이를 오픈소스로 공개하여 트레이더들이 기능을 검토하고 검증할 수 있도록 했습니다. 작성자에게 찬사를 보냅니다! 이 코드는 무료로 사용할 수 있지만, 코드를 재게시하는 경우 하우스 룰이 적용된다는 점을 기억하세요.
면책사항
해당 정보와 게시물은 금융, 투자, 트레이딩 또는 기타 유형의 조언이나 권장 사항으로 간주되지 않으며, 트레이딩뷰에서 제공하거나 보증하는 것이 아닙니다. 자세한 내용은 이용 약관을 참조하세요.