OPEN-SOURCE SCRIPT
업데이트됨 Bullseye PDHL
Bullseye PDHL Indicator
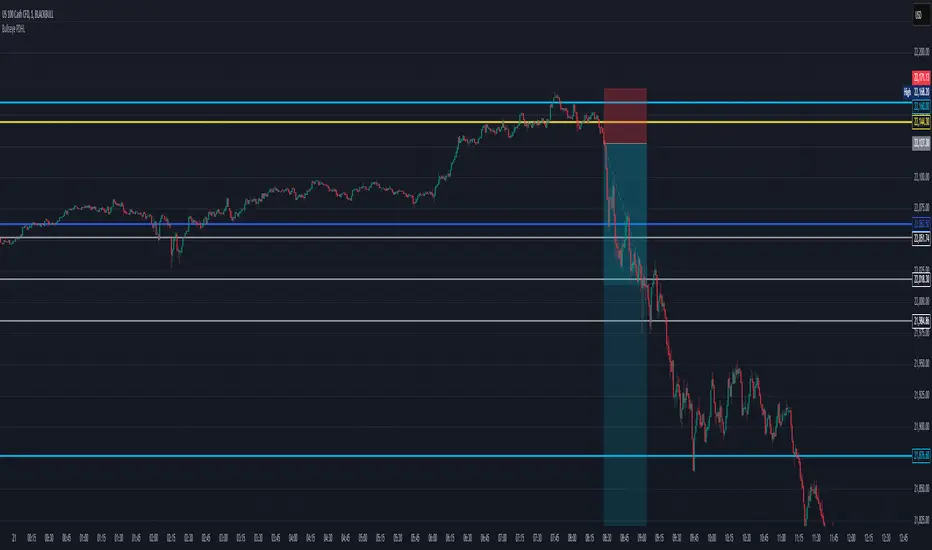
The Bullseye PDHL indicator is designed for traders who want to visually identify key price levels from the previous trading day, including the high, low, and significant Fibonacci retracement levels. This indicator helps traders understand potential support and resistance zones, which can be useful for planning entries and exits.
Key Features:
Previous Day’s High and Low:
Plots the previous day’s high and low as solid lines on the chart to easily identify important levels from the prior session.
These levels serve as critical support and resistance markers, which are often respected by the market.
Fibonacci Retracement Levels:
Plots three Fibonacci retracement levels (38.2%, 50%, and 61.8%) between the previous day’s high and low.
These levels are key reference points for assessing potential pullbacks or retracements during the current trading day.
Visual Representation:
The previous day’s high and low are plotted in cyan for easy differentiation.
The Fibonacci retracement levels (30%, 50%, 60%) are plotted in white, providing a clear visual reference for traders.
This indicator can help traders identify important reaction zones and areas where price might reverse or consolidate, making it a valuable addition for technical analysis.
릴리즈 노트
Cool Update to Bullseye PDHL on TradingView!Hey traders! 🚀 Check out the latest tweak to the Bullseye PDHL indicator—it's now got neat switches to show or hide yesterday's open and close prices right on your charts. Customize your view, keep your charts slick, and make analyzing those price moves easier than ever! Jump into your next trade with style with the new Bullseye PDHL!
오픈 소스 스크립트
트레이딩뷰의 진정한 정신에 따라, 이 스크립트의 작성자는 이를 오픈소스로 공개하여 트레이더들이 기능을 검토하고 검증할 수 있도록 했습니다. 작성자에게 찬사를 보냅니다! 이 코드는 무료로 사용할 수 있지만, 코드를 재게시하는 경우 하우스 룰이 적용된다는 점을 기억하세요.
면책사항
해당 정보와 게시물은 금융, 투자, 트레이딩 또는 기타 유형의 조언이나 권장 사항으로 간주되지 않으며, 트레이딩뷰에서 제공하거나 보증하는 것이 아닙니다. 자세한 내용은 이용 약관을 참조하세요.
오픈 소스 스크립트
트레이딩뷰의 진정한 정신에 따라, 이 스크립트의 작성자는 이를 오픈소스로 공개하여 트레이더들이 기능을 검토하고 검증할 수 있도록 했습니다. 작성자에게 찬사를 보냅니다! 이 코드는 무료로 사용할 수 있지만, 코드를 재게시하는 경우 하우스 룰이 적용된다는 점을 기억하세요.
면책사항
해당 정보와 게시물은 금융, 투자, 트레이딩 또는 기타 유형의 조언이나 권장 사항으로 간주되지 않으며, 트레이딩뷰에서 제공하거나 보증하는 것이 아닙니다. 자세한 내용은 이용 약관을 참조하세요.