OPEN-SOURCE SCRIPT
Bolingger Bands + Inside Bar Boxes
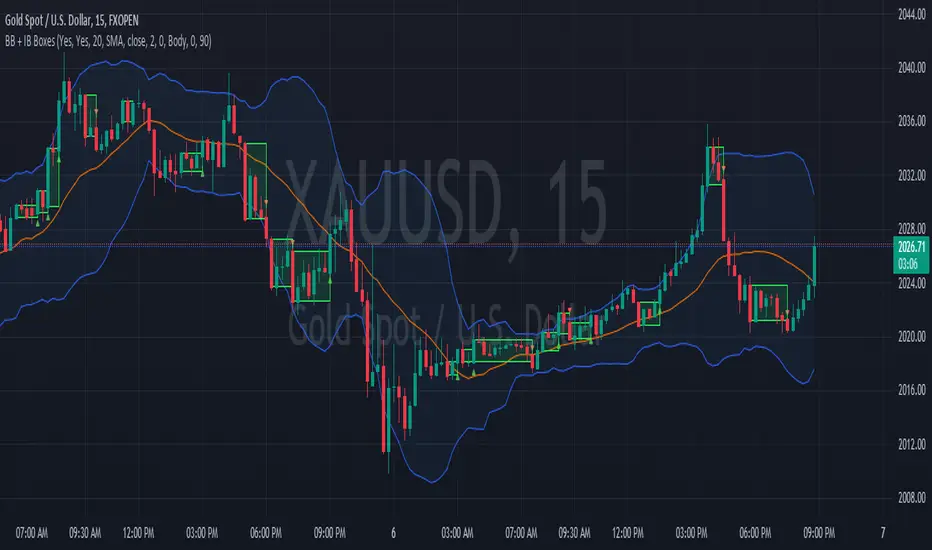
Bollinger Bands are a technical analysis tool consist of three bands—an upper, middle, and lower band—that are used to spotlight extreme short-term prices in a security. The upper band represents overbought territory, while the lower band can show you when a security is oversold. Most technicians will use Bollinger Bands® in conjunction with other analysis tools to get a better picture of the current state of a market or security.
An Inside Bar is a two-bar price action trading strategy in which the inside bar is smaller and within the high to low range of the prior bar. Inside bars show a period of consolidation in a market. They often form following a strong move in a market, as it ‘pauses’ to consolidate before making its next move. However, they can also form at market turning points and act as reversal signals from key support or resistance levels.
An Inside Bar is a two-bar price action trading strategy in which the inside bar is smaller and within the high to low range of the prior bar. Inside bars show a period of consolidation in a market. They often form following a strong move in a market, as it ‘pauses’ to consolidate before making its next move. However, they can also form at market turning points and act as reversal signals from key support or resistance levels.
오픈 소스 스크립트
트레이딩뷰의 진정한 정신에 따라, 이 스크립트의 작성자는 이를 오픈소스로 공개하여 트레이더들이 기능을 검토하고 검증할 수 있도록 했습니다. 작성자에게 찬사를 보냅니다! 이 코드는 무료로 사용할 수 있지만, 코드를 재게시하는 경우 하우스 룰이 적용된다는 점을 기억하세요.
면책사항
해당 정보와 게시물은 금융, 투자, 트레이딩 또는 기타 유형의 조언이나 권장 사항으로 간주되지 않으며, 트레이딩뷰에서 제공하거나 보증하는 것이 아닙니다. 자세한 내용은 이용 약관을 참조하세요.
오픈 소스 스크립트
트레이딩뷰의 진정한 정신에 따라, 이 스크립트의 작성자는 이를 오픈소스로 공개하여 트레이더들이 기능을 검토하고 검증할 수 있도록 했습니다. 작성자에게 찬사를 보냅니다! 이 코드는 무료로 사용할 수 있지만, 코드를 재게시하는 경우 하우스 룰이 적용된다는 점을 기억하세요.
면책사항
해당 정보와 게시물은 금융, 투자, 트레이딩 또는 기타 유형의 조언이나 권장 사항으로 간주되지 않으며, 트레이딩뷰에서 제공하거나 보증하는 것이 아닙니다. 자세한 내용은 이용 약관을 참조하세요.