OPEN-SOURCE SCRIPT
업데이트됨 tickerTracker MFI Oscillator

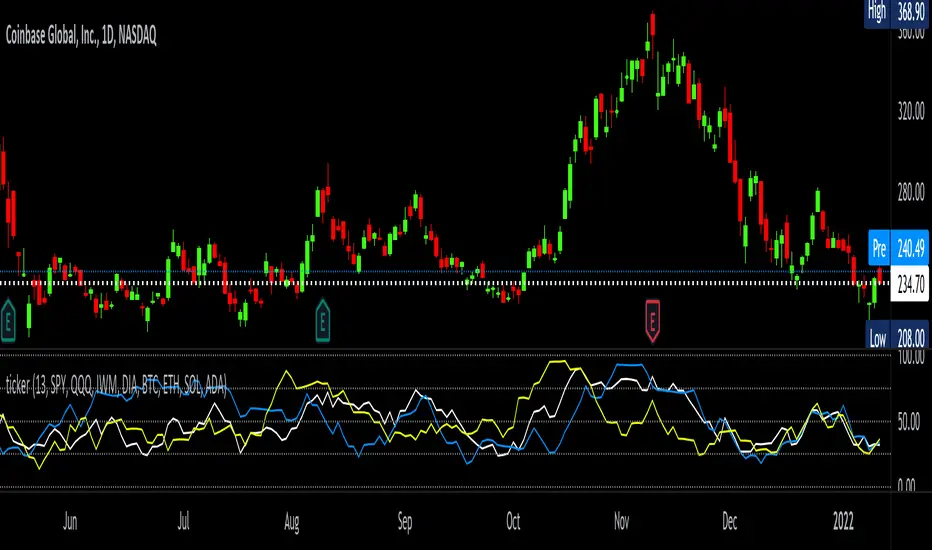
Did you ever want to have a neat indicator window in line with your chart showing a different ticker? tickerTracker is a Money Flow Index (MFI) oscillator. The Money Flow Index (MFI) is a technical oscillator that uses price and volume for identifying overbought or oversold conditions in an asset. More or less, everything is connected in the market. The tickerTracker lets you see what is happening with another ticker that you have connected a correlation between them. For my example here, I'm using COIN in the main chart with the tickerTracker displaying BTC, QQQ and COIN Money Flow Index (MFI) in its window. As the end user, you can customize the colors, the length input and the ticker. Like any other indicator, the shorter length input, the more quickly responsive and the longer the length input, the smoother curve print.
Default Values:
MFI Length = 13
Chart ticker = white
SPY = white
QQQ = blue
IWM = yellow
DIA = orange
BTC/USD = yellow
ETH/USD = green
SOL/USD = purple
ADA/USD = red
Do your own due diligence, your risk is 100% your responsibility. This is for educational and entertainment purposes only. You win some or you learn some. Consider being charitable with some of your profit to help humankind. Good luck and happy trading friends...
*3x lucky 7s of trading*
7pt Trading compass:
Price action, entry/exit
Volume average/direction
Trend, patterns, momentum
Newsworthy current events
Revenue
Earnings
Balance sheet
7 Common mistakes:
+5% portfolio trades, capital risk management
Beware of analyst's motives
Emotions & Opinions
FOMO : bad timing, the market is ruthless, be shrewd
Lack of planning & discipline
Forgetting restraint
Obdurate repetitive errors, no adaptation
7 Important tools:
Trading View app!, Brokerage UI
Accurate indicators & settings
Wide screen monitor/s
Trading log (pencil & graph paper)
Big, organized desk
Reading books, playing chess
Sorted watch-list
Checkout my indicators:
Fibonacci VIP - volume
Fibonacci MA7 - price
pi RSI - trend momentum
TTC - trend channel
AlertiT - notification
tickerTracker - MFI Oscillator
tradingview.com/u/growerik/
릴리즈 노트
update +2=11x tickers total possible&
add a trackprice line choice
릴리즈 노트
header update릴리즈 노트
Add a MFI or RSI option checkbox오픈 소스 스크립트
트레이딩뷰의 진정한 정신에 따라, 이 스크립트의 작성자는 이를 오픈소스로 공개하여 트레이더들이 기능을 검토하고 검증할 수 있도록 했습니다. 작성자에게 찬사를 보냅니다! 이 코드는 무료로 사용할 수 있지만, 코드를 재게시하는 경우 하우스 룰이 적용된다는 점을 기억하세요.
Trading indicators:
tradingview.com/u/Options360/
tradingview.com/u/Options360/
면책사항
해당 정보와 게시물은 금융, 투자, 트레이딩 또는 기타 유형의 조언이나 권장 사항으로 간주되지 않으며, 트레이딩뷰에서 제공하거나 보증하는 것이 아닙니다. 자세한 내용은 이용 약관을 참조하세요.
오픈 소스 스크립트
트레이딩뷰의 진정한 정신에 따라, 이 스크립트의 작성자는 이를 오픈소스로 공개하여 트레이더들이 기능을 검토하고 검증할 수 있도록 했습니다. 작성자에게 찬사를 보냅니다! 이 코드는 무료로 사용할 수 있지만, 코드를 재게시하는 경우 하우스 룰이 적용된다는 점을 기억하세요.
Trading indicators:
tradingview.com/u/Options360/
tradingview.com/u/Options360/
면책사항
해당 정보와 게시물은 금융, 투자, 트레이딩 또는 기타 유형의 조언이나 권장 사항으로 간주되지 않으며, 트레이딩뷰에서 제공하거나 보증하는 것이 아닙니다. 자세한 내용은 이용 약관을 참조하세요.