OPEN-SOURCE SCRIPT
Volume Distribution Deviation
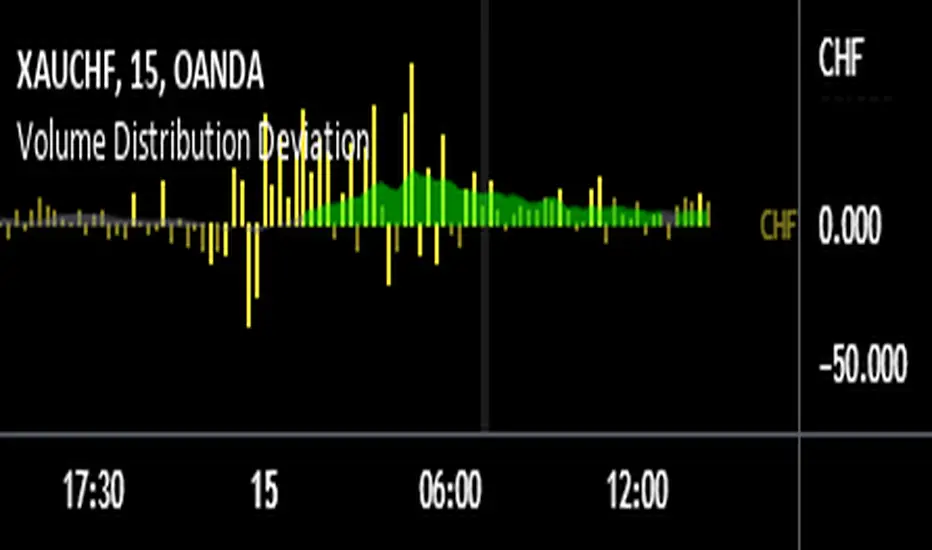
This indicator explores the question - "Does a currency's PERCENTAGE of trading volume verses other currencies show an insight into market sentiment?"
Specifically, it calculates the average market share based on the same time of day for a given number of days back (10 days by default) for trades involving the selected currency then presents fluctuations from that average as a percentage.
For example, assume that currencies involving EUR (EURUSD, EURAUD, EURCAD etc…) on average account for 20% of trading volume at 8am GMT (London open) however today at London open EUR crosses account for 30% at London open – 50% higher than usual. Does this information give us a heads up for market sentiment for the next few hours? And what if EUR volume was 50% higher than average and USD was 30% lower than average – should we focus on EUR and pass on USD that session?
Note that the indicator is not presenting information regarding volume quantity – it is showing you interest in that currency within the volume occurring that day. I already have an indicator that compares volume quantity to average volume quantity for that time of day, this takes the concept a little further and shows the normalised deviations from that average. So if USD volume was up 50% and NZD was up 50% they will show as equal on the indicator even though the actual traded volume of USD is probably x10 higher.
I find the 15 minute timeframe gives the most meaningful data. I use an 8 window chart and display the deviations for each currency (NZD, AUD, JPY, CHF, EUR, GBP, CAD, USD). If you set to 'Automatic' the indicator will automatically chose the currency based on the currency you crossed with gold (OANDA:XAUNZD, OANDA:XAUAUD, OANDA:XAUJPY, OANDA:XAUCHF, OANDA:XAUEUR, OANDA:XAUGBP, OANDA:XAUCAD, OANDA:XAUUSD). I tend to look at the average deviation rather than an isolated spike.
There are features in the indicator to try to summarise and highlight impactful data - highlighted deviations over a set tolerance (10% by default) and the SMA of the deviations.
Good luck
오픈 소스 스크립트
트레이딩뷰의 진정한 정신에 따라, 이 스크립트의 작성자는 이를 오픈소스로 공개하여 트레이더들이 기능을 검토하고 검증할 수 있도록 했습니다. 작성자에게 찬사를 보냅니다! 이 코드는 무료로 사용할 수 있지만, 코드를 재게시하는 경우 하우스 룰이 적용된다는 점을 기억하세요.
면책사항
해당 정보와 게시물은 금융, 투자, 트레이딩 또는 기타 유형의 조언이나 권장 사항으로 간주되지 않으며, 트레이딩뷰에서 제공하거나 보증하는 것이 아닙니다. 자세한 내용은 이용 약관을 참조하세요.
오픈 소스 스크립트
트레이딩뷰의 진정한 정신에 따라, 이 스크립트의 작성자는 이를 오픈소스로 공개하여 트레이더들이 기능을 검토하고 검증할 수 있도록 했습니다. 작성자에게 찬사를 보냅니다! 이 코드는 무료로 사용할 수 있지만, 코드를 재게시하는 경우 하우스 룰이 적용된다는 점을 기억하세요.
면책사항
해당 정보와 게시물은 금융, 투자, 트레이딩 또는 기타 유형의 조언이나 권장 사항으로 간주되지 않으며, 트레이딩뷰에서 제공하거나 보증하는 것이 아닙니다. 자세한 내용은 이용 약관을 참조하세요.