PROTECTED SOURCE SCRIPT
업데이트됨 CCT Dynamic Stoch KDJ
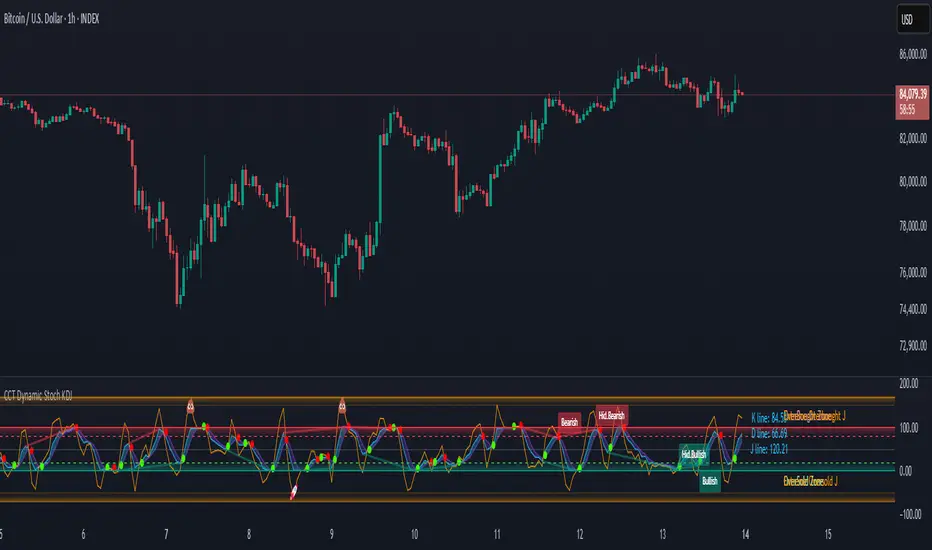
CCT Dynamic Stoch KDJ
The CCT Dynamic Stoch KDJ is an advanced momentum oscillator designed to enhance trend identification, overbought/oversold (OB/OS) zone detection, and volatility analysis. By integrating Stochastic RSI with the KDJ framework, this indicator provides a precise and adaptive approach to market dynamics across multiple timeframes.
Core Methodology: Understanding the KDJ Indicator
The KDJ indicator expands upon the traditional Stochastic Oscillator by introducing the J Line, a calculated momentum component that offers enhanced responsiveness to market fluctuations. The three primary components of this indicator are:
By incorporating the J Line, the indicator offers a more refined reading of price acceleration and deviation, making it particularly effective in high-volatility environments.

Adaptive Timeframe-Based Parameters
Unlike static oscillators, the CCT Dynamic Stoch KDJ dynamically adjusts its length parameters based on the chart’s timeframe, optimizing readings for different trading styles:
This adaptive parameterization ensures that traders receive relevant and context-specific momentum signals, whether executing short-term scalps or analyzing macro trends.
Key Features & Usability Enhancements
1) Overbought & Oversold Zones with Extreme Levels
Standard OB/OS thresholds at 80 and 20, identifying potential trend exhaustion and reversal points.
Extended extreme zones enhance detection of high probability mean-reversion opportunities in overextended markets.

2) J Line as a Volatility Detector
The J Line excels at capturing sharp price movements, making it a powerful tool for momentum acceleration analysis.
When the J Line sharply diverges from the %K and %D lines, it signals an impending trend shift or breakout.
3) Divergence Detection for Momentum Shifts
Automatic bullish and bearish divergences indicate momentum weakening or trend continuation potential, even when price action seems stable.
Hidden divergences help confirm trend strength during retracements.

4) Smart Alerts for Key Market Events
Alerts trigger when the %K Line enters Overbought/Oversold zones, providing actionable trade setups.
Crossovers between %K and %D Lines highlight potential trend reversals or continuation signals.
5) Customizable Smoothing for Precision Trading
Users can adjust %K and %D smoothing settings, fine-tuning the indicator’s sensitivity based on market conditions and individual trading preferences.
Technical Implementation
Developed in Pine Script V6, ensuring compatibility with TradingView’s standard functions and calculations.
This guarantees accuracy and reliability, with all indicator values reflecting real-time market conditions without external data dependencies.
Disclaimer
This indicator is intended for technical analysis purposes only and does not constitute financial advice. Markets are inherently unpredictable, and past performance is not indicative of future results. Traders should perform independent analysis and apply risk management strategies when utilizing this tool.
The CCT Dynamic Stoch KDJ is an advanced momentum oscillator designed to enhance trend identification, overbought/oversold (OB/OS) zone detection, and volatility analysis. By integrating Stochastic RSI with the KDJ framework, this indicator provides a precise and adaptive approach to market dynamics across multiple timeframes.
Core Methodology: Understanding the KDJ Indicator
The KDJ indicator expands upon the traditional Stochastic Oscillator by introducing the J Line, a calculated momentum component that offers enhanced responsiveness to market fluctuations. The three primary components of this indicator are:
- %K Line
- %D Line
- J Line
By incorporating the J Line, the indicator offers a more refined reading of price acceleration and deviation, making it particularly effective in high-volatility environments.
Adaptive Timeframe-Based Parameters
Unlike static oscillators, the CCT Dynamic Stoch KDJ dynamically adjusts its length parameters based on the chart’s timeframe, optimizing readings for different trading styles:
- Scalping Mode (Short-term) –
- Intraday Mode (Medium-term) –
- Swing/Position Mode (Long-term) –
This adaptive parameterization ensures that traders receive relevant and context-specific momentum signals, whether executing short-term scalps or analyzing macro trends.
Key Features & Usability Enhancements
1) Overbought & Oversold Zones with Extreme Levels
Standard OB/OS thresholds at 80 and 20, identifying potential trend exhaustion and reversal points.
Extended extreme zones enhance detection of high probability mean-reversion opportunities in overextended markets.
2) J Line as a Volatility Detector
The J Line excels at capturing sharp price movements, making it a powerful tool for momentum acceleration analysis.
When the J Line sharply diverges from the %K and %D lines, it signals an impending trend shift or breakout.
3) Divergence Detection for Momentum Shifts
Automatic bullish and bearish divergences indicate momentum weakening or trend continuation potential, even when price action seems stable.
Hidden divergences help confirm trend strength during retracements.
4) Smart Alerts for Key Market Events
Alerts trigger when the %K Line enters Overbought/Oversold zones, providing actionable trade setups.
Crossovers between %K and %D Lines highlight potential trend reversals or continuation signals.
5) Customizable Smoothing for Precision Trading
Users can adjust %K and %D smoothing settings, fine-tuning the indicator’s sensitivity based on market conditions and individual trading preferences.
Technical Implementation
Developed in Pine Script V6, ensuring compatibility with TradingView’s standard functions and calculations.
This guarantees accuracy and reliability, with all indicator values reflecting real-time market conditions without external data dependencies.
Disclaimer
This indicator is intended for technical analysis purposes only and does not constitute financial advice. Markets are inherently unpredictable, and past performance is not indicative of future results. Traders should perform independent analysis and apply risk management strategies when utilizing this tool.
릴리즈 노트
Update Chart보호된 스크립트입니다
이 스크립트는 비공개 소스로 게시됩니다. 하지만 이를 자유롭게 제한 없이 사용할 수 있습니다 – 자세한 내용은 여기에서 확인하세요.
TA / OnChain Analyst since 2018
Official TA Analyst of LigaCrypto YT Channel
Back/Front end Developer
Official TA Analyst of LigaCrypto YT Channel
Back/Front end Developer
면책사항
해당 정보와 게시물은 금융, 투자, 트레이딩 또는 기타 유형의 조언이나 권장 사항으로 간주되지 않으며, 트레이딩뷰에서 제공하거나 보증하는 것이 아닙니다. 자세한 내용은 이용 약관을 참조하세요.
보호된 스크립트입니다
이 스크립트는 비공개 소스로 게시됩니다. 하지만 이를 자유롭게 제한 없이 사용할 수 있습니다 – 자세한 내용은 여기에서 확인하세요.
TA / OnChain Analyst since 2018
Official TA Analyst of LigaCrypto YT Channel
Back/Front end Developer
Official TA Analyst of LigaCrypto YT Channel
Back/Front end Developer
면책사항
해당 정보와 게시물은 금융, 투자, 트레이딩 또는 기타 유형의 조언이나 권장 사항으로 간주되지 않으며, 트레이딩뷰에서 제공하거나 보증하는 것이 아닙니다. 자세한 내용은 이용 약관을 참조하세요.