OPEN-SOURCE SCRIPT
Rainbow Fisher - AYNET
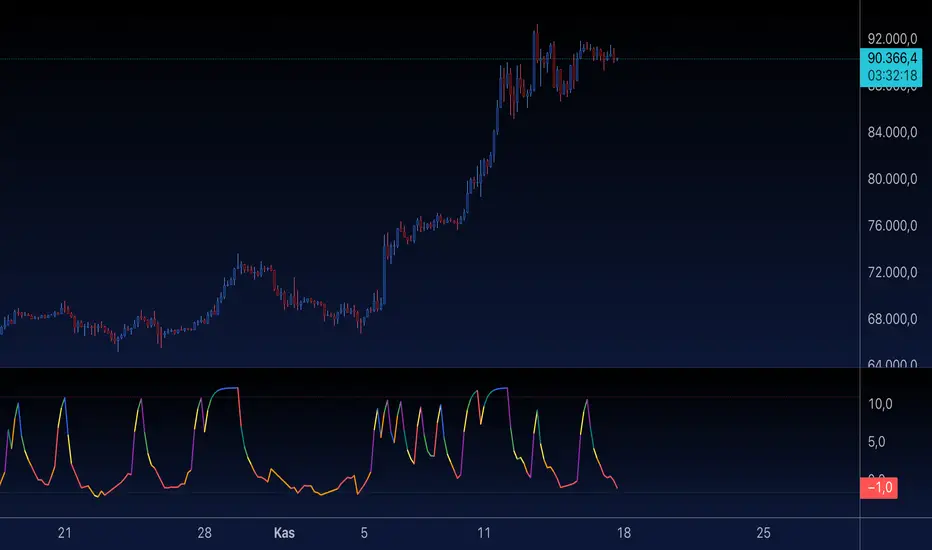
The Rainbow Fisher Indicator is inspired by John Ehlers' work on the Fisher Transform, a tool designed to normalize price movements and highlight overbought and oversold conditions. This script combines Ehlers' Fisher Transform with a rainbow visualization for enhanced trend analysis.
Summary of the Code
Fisher Transform Calculation:
The indicator calculates the Fisher Transform based on normalized high-low price data (hl2), which emphasizes turning points in market trends.
Rainbow Visualization:
The Fisher line is dynamically colored using a rainbow gradient to visually represent the magnitude and direction of market movements.
Overbought/Oversold Levels:
Configurable horizontal lines mark thresholds (1.5 for overbought and -1.5 for oversold by default), helping traders identify extremes in price action.
Signal Labels:
Labels are displayed when the Fisher line crosses the overbought or oversold levels, providing clear visual cues for potential market reversals.
Acknowledgment:
This indicator is an homage to John Ehlers' groundbreaking work in digital signal processing for financial markets.
How to Use
Trend Reversal Detection:
Use the overbought and oversold levels to identify potential turning points in market trends.
Momentum Analysis:
Observe the rainbow-colored Fisher line for directional cues and the strength of price movements.
Customization
Adjust the Fisher Transform length to refine sensitivity.
Modify overbought/oversold levels to align with your trading strategy.
Enable or disable the rainbow effect for simplicity or added clarity.
Let me know if you’d like further refinements or additional features! 🌈
오픈 소스 스크립트
트레이딩뷰의 진정한 정신에 따라, 이 스크립트의 작성자는 이를 오픈소스로 공개하여 트레이더들이 기능을 검토하고 검증할 수 있도록 했습니다. 작성자에게 찬사를 보냅니다! 이 코드는 무료로 사용할 수 있지만, 코드를 재게시하는 경우 하우스 룰이 적용된다는 점을 기억하세요.
면책사항
해당 정보와 게시물은 금융, 투자, 트레이딩 또는 기타 유형의 조언이나 권장 사항으로 간주되지 않으며, 트레이딩뷰에서 제공하거나 보증하는 것이 아닙니다. 자세한 내용은 이용 약관을 참조하세요.
오픈 소스 스크립트
트레이딩뷰의 진정한 정신에 따라, 이 스크립트의 작성자는 이를 오픈소스로 공개하여 트레이더들이 기능을 검토하고 검증할 수 있도록 했습니다. 작성자에게 찬사를 보냅니다! 이 코드는 무료로 사용할 수 있지만, 코드를 재게시하는 경우 하우스 룰이 적용된다는 점을 기억하세요.
면책사항
해당 정보와 게시물은 금융, 투자, 트레이딩 또는 기타 유형의 조언이나 권장 사항으로 간주되지 않으며, 트레이딩뷰에서 제공하거나 보증하는 것이 아닙니다. 자세한 내용은 이용 약관을 참조하세요.