OPEN-SOURCE SCRIPT
업데이트됨 True Balance of power
This is an improvement of the script published by LazyBear, 
The improvements are:
1. it includes gaps because it uses true range in stead of the current bar,
2. it has been turned into a percent oscillator as the basic algorithm belongs in the family of stochastic oscillators.
Unlike the usual stochatics I refrained from over the top averaging and smoothing, nor did I attempt a signal line. There’s no need to make a mock MACD.
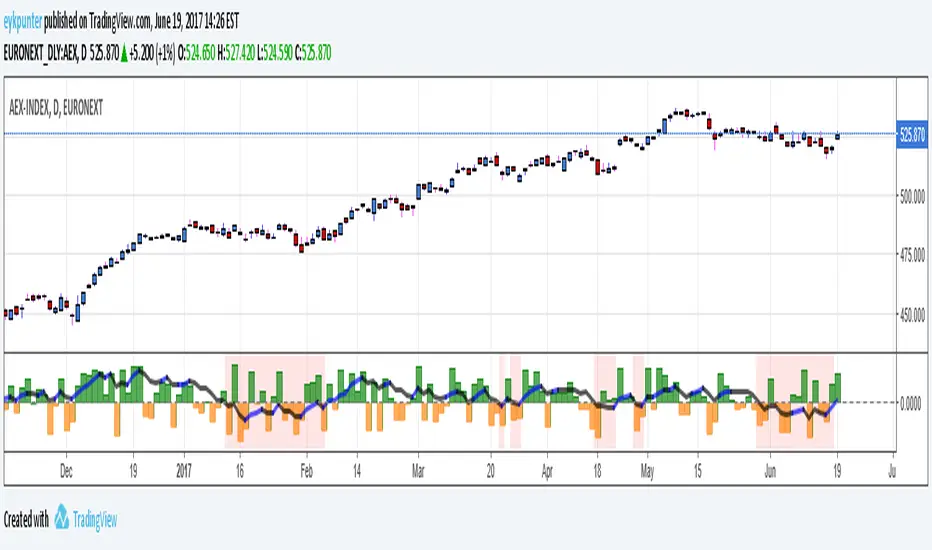
The indicator should be interpreted as a stochastics, the difference between Stochs and MACD is that stochs report inclinations, i.e. in which direction the market is edging, while MACD reports movements, in which direction the market is moving. Stochs are an early indicator, MACD is lagging. The emoline is a 30 period linear regression, I use linear regressions because these have no lagging, react immidiately to changes, I use a 30 period version because that is not so nervous. You might say that an MA gives an average while a linear regression gives an ‘over all’ of the periods.
The back ground color is red when the emoline is below zero, that is where the market ‘looks down’, white where the market ‘looks up’. This doesn’t mean that the market will actually go down or up, it may allways change its mind.
Have fun and take care, Eykpunter.
The improvements are:
1. it includes gaps because it uses true range in stead of the current bar,
2. it has been turned into a percent oscillator as the basic algorithm belongs in the family of stochastic oscillators.
Unlike the usual stochatics I refrained from over the top averaging and smoothing, nor did I attempt a signal line. There’s no need to make a mock MACD.
The indicator should be interpreted as a stochastics, the difference between Stochs and MACD is that stochs report inclinations, i.e. in which direction the market is edging, while MACD reports movements, in which direction the market is moving. Stochs are an early indicator, MACD is lagging. The emoline is a 30 period linear regression, I use linear regressions because these have no lagging, react immidiately to changes, I use a 30 period version because that is not so nervous. You might say that an MA gives an average while a linear regression gives an ‘over all’ of the periods.
The back ground color is red when the emoline is below zero, that is where the market ‘looks down’, white where the market ‘looks up’. This doesn’t mean that the market will actually go down or up, it may allways change its mind.
Have fun and take care, Eykpunter.
릴리즈 노트
I fixed the fault that changing the periods in the inputs had no effect. Now it has.릴리즈 노트
Added comments in the script and changed the names of some variables in more suggestive mnemonics.오픈 소스 스크립트
트레이딩뷰의 진정한 정신에 따라, 이 스크립트의 작성자는 이를 오픈소스로 공개하여 트레이더들이 기능을 검토하고 검증할 수 있도록 했습니다. 작성자에게 찬사를 보냅니다! 이 코드는 무료로 사용할 수 있지만, 코드를 재게시하는 경우 하우스 룰이 적용된다는 점을 기억하세요.
면책사항
해당 정보와 게시물은 금융, 투자, 트레이딩 또는 기타 유형의 조언이나 권장 사항으로 간주되지 않으며, 트레이딩뷰에서 제공하거나 보증하는 것이 아닙니다. 자세한 내용은 이용 약관을 참조하세요.
오픈 소스 스크립트
트레이딩뷰의 진정한 정신에 따라, 이 스크립트의 작성자는 이를 오픈소스로 공개하여 트레이더들이 기능을 검토하고 검증할 수 있도록 했습니다. 작성자에게 찬사를 보냅니다! 이 코드는 무료로 사용할 수 있지만, 코드를 재게시하는 경우 하우스 룰이 적용된다는 점을 기억하세요.
면책사항
해당 정보와 게시물은 금융, 투자, 트레이딩 또는 기타 유형의 조언이나 권장 사항으로 간주되지 않으며, 트레이딩뷰에서 제공하거나 보증하는 것이 아닙니다. 자세한 내용은 이용 약관을 참조하세요.