OPEN-SOURCE SCRIPT
KAI QUANTUM Candles Analysis - Yearly Breakdown
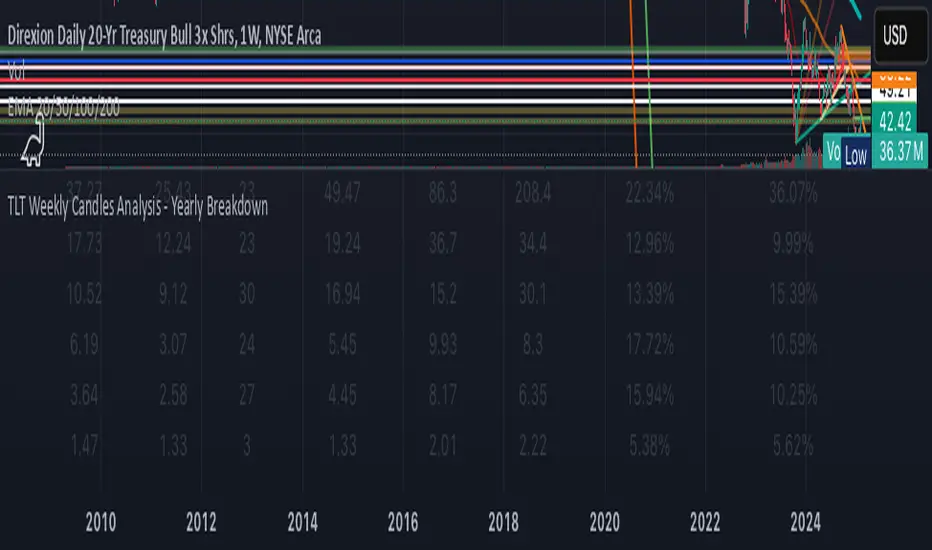
The "KAI QUANTUM Analysis – Yearly Breakdown" indicator offers a comprehensive, year-by-year examination of candlestick behavior, enabling traders and analysts to gauge market dynamics over extended periods. Key features include:
Yearly Aggregation:
The indicator groups candlestick data by year, providing a clear snapshot of market behavior for each period.
Dual-Color Analysis:
It categorizes candles as bullish (green) or bearish (red) and computes statistics separately for each, allowing you to assess both upward and downward market trends.
Average Body Size & Candle Count:
For each year, the indicator calculates the average body size of green and red candles and tracks the total number of each, helping you understand overall market volatility and momentum.
Top 10 Candle Analysis:
It identifies the ten largest candles (by body size) in each year and computes their average size, offering insight into the most significant market moves during that period.
Largest Candle Metrics:
The indicator determines the absolute size of the largest green and red candles in each year.
Percentage Move Calculation:
In addition to absolute values, it computes the largest move as a percentage of the open price for both green and red candles. This allows you to see not only which year experienced the biggest moves but also how those moves compare relative to the opening price.
Clear Tabular Display:
All the computed statistics are organized in an on-chart table, making it easy to compare yearly trends at a glance.
Ideal for daily and higher timeframes, this indicator is a valuable tool for long-term market analysis, enabling you to identify trends, assess volatility, and make informed trading decisions based on historical market behavior.
오픈 소스 스크립트
트레이딩뷰의 진정한 정신에 따라, 이 스크립트의 작성자는 이를 오픈소스로 공개하여 트레이더들이 기능을 검토하고 검증할 수 있도록 했습니다. 작성자에게 찬사를 보냅니다! 이 코드는 무료로 사용할 수 있지만, 코드를 재게시하는 경우 하우스 룰이 적용된다는 점을 기억하세요.
면책사항
해당 정보와 게시물은 금융, 투자, 트레이딩 또는 기타 유형의 조언이나 권장 사항으로 간주되지 않으며, 트레이딩뷰에서 제공하거나 보증하는 것이 아닙니다. 자세한 내용은 이용 약관을 참조하세요.
오픈 소스 스크립트
트레이딩뷰의 진정한 정신에 따라, 이 스크립트의 작성자는 이를 오픈소스로 공개하여 트레이더들이 기능을 검토하고 검증할 수 있도록 했습니다. 작성자에게 찬사를 보냅니다! 이 코드는 무료로 사용할 수 있지만, 코드를 재게시하는 경우 하우스 룰이 적용된다는 점을 기억하세요.
면책사항
해당 정보와 게시물은 금융, 투자, 트레이딩 또는 기타 유형의 조언이나 권장 사항으로 간주되지 않으며, 트레이딩뷰에서 제공하거나 보증하는 것이 아닙니다. 자세한 내용은 이용 약관을 참조하세요.