OPEN-SOURCE SCRIPT
Back to the Future
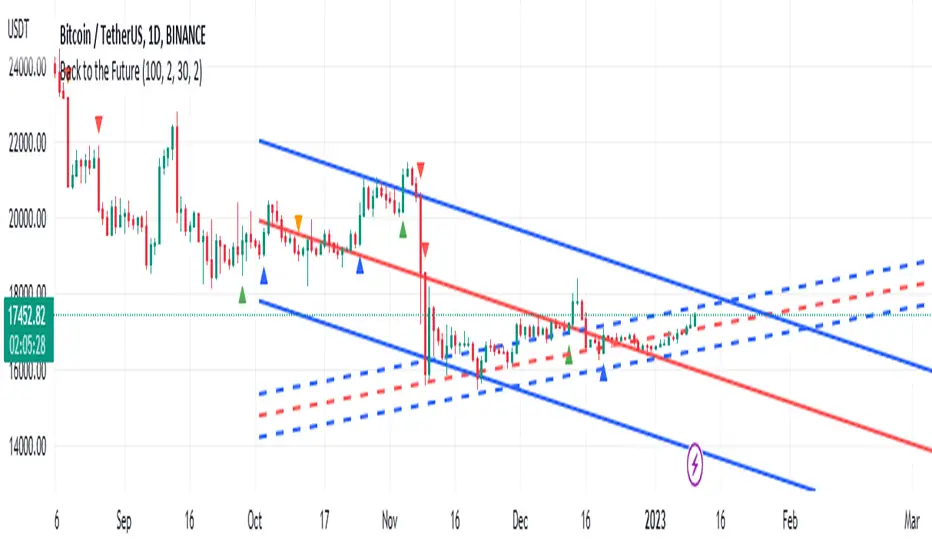
Hallo, very simple indicator in order to view trends
we have two linear regressions
one is the regular one that we know at length 100
the other one is lagging or past linear which is shorter at length 30
the basic idea is that when we combine both we can see trend of the current and the past linear when they cross each other and from this we can make signals.
Assuming that past shorter trend has the value of resistance or threshold values, so cross of current linear of those points can show if the trend is to buy or to sell by signals seen in the arrows .
So past and present mix and give us the future.
need to solve issue when market goes sideways but it easy to see how the trend look by the signals .
past linear seen in concave lines the current is the other one.
signals of positive trends are arrow up green or blue. negative trend red or orange arrow down
오픈 소스 스크립트
트레이딩뷰의 진정한 정신에 따라, 이 스크립트의 작성자는 이를 오픈소스로 공개하여 트레이더들이 기능을 검토하고 검증할 수 있도록 했습니다. 작성자에게 찬사를 보냅니다! 이 코드는 무료로 사용할 수 있지만, 코드를 재게시하는 경우 하우스 룰이 적용된다는 점을 기억하세요.
면책사항
해당 정보와 게시물은 금융, 투자, 트레이딩 또는 기타 유형의 조언이나 권장 사항으로 간주되지 않으며, 트레이딩뷰에서 제공하거나 보증하는 것이 아닙니다. 자세한 내용은 이용 약관을 참조하세요.
오픈 소스 스크립트
트레이딩뷰의 진정한 정신에 따라, 이 스크립트의 작성자는 이를 오픈소스로 공개하여 트레이더들이 기능을 검토하고 검증할 수 있도록 했습니다. 작성자에게 찬사를 보냅니다! 이 코드는 무료로 사용할 수 있지만, 코드를 재게시하는 경우 하우스 룰이 적용된다는 점을 기억하세요.
면책사항
해당 정보와 게시물은 금융, 투자, 트레이딩 또는 기타 유형의 조언이나 권장 사항으로 간주되지 않으며, 트레이딩뷰에서 제공하거나 보증하는 것이 아닙니다. 자세한 내용은 이용 약관을 참조하세요.