INVITE-ONLY SCRIPT
업데이트됨 Mean Reversion Period Tracker (600 Max) [acatwithwithcharts]
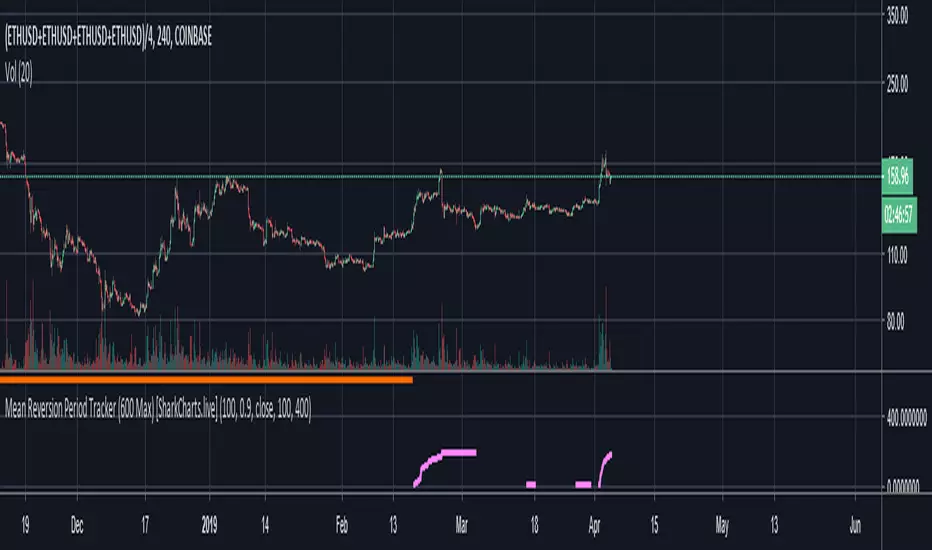
Mean Reversion MA is an experimental WIP -indicator which tracks the furthest overexpanded period on a given timeframe as a target for eventual mean reversion. Mean Reversion Period Tracker is an adjunctive indicator for quickly determining which period length is currently being tracked.
This version caps the maximum period length at 600, an empirically-chosen number based on some testing to try to avoid picking overly distant targets. The display color also changes to orange when the period is maxed out as a warning that the maximum has been reached and that the true further overexpanded period is likely to be further out.
I am posting this as invite-only and have a short list of collaborators in mind who will get access if they want it. It is not being made available to the general public as of this posting; I’m vaguely working towards eventually offering being able to offer some sort of paid indicator offering in the future.
Rather than shut the door entirely, I will say that if someone approaches me by PM with a really interesting idea on how they’d like to test this or my other indicators, I’m willing to consider giving access. I’m not giving this away just to anyone who asks and will, for my own time and sanity, probably just ignore requests by people who don't come to me already knowing what this indicator does and how they might want to use it.
릴리즈 노트
This version adds the ability to reset tracking after a given number of bars and the ability to set a lower maximum period length as tools to help look at smaller overexpansions occurring before the largest one has completed mean reversion.릴리즈 노트
Updated to change the attribution in the title from “acatwithcharts” to “SharkCharts.live”.I'm excited to announce that we're putting the finishing touches on a subscription service for the volatility theory indicators, and assuming no hiccups will launch them within days. Subscriptions will be available in several packages through SharkCharts.live
Current pricing and subscription details will be kept up-to-date on SharkCharts.live
릴리즈 노트
Increased default line thickness as it's becoming popular among subscribers to overlay the period tracker scripts over 3D WAVE-PM in the same window, for which the increased thickness is very helpful in visually distinguishing the indicator.초대 전용 스크립트
이 스크립트는 작성자가 승인한 사용자만 접근할 수 있습니다. 사용하려면 요청 후 승인을 받아야 하며, 일반적으로 결제 후에 허가가 부여됩니다. 자세한 내용은 아래 작성자의 안내를 따르거나 acatwithcharts에게 직접 문의하세요.
트레이딩뷰는 스크립트의 작동 방식을 충분히 이해하고 작성자를 완전히 신뢰하지 않는 이상, 해당 스크립트에 비용을 지불하거나 사용하는 것을 권장하지 않습니다. 커뮤니티 스크립트에서 무료 오픈소스 대안을 찾아보실 수도 있습니다.
작성자 지시 사항
My volatility-based indicators are available for sale at SharkCharts.live
Feel free to reach out to me with any questions; more information is available on the SharkCharts website and the SharkCharts discord discord.gg/YVpTeSK
Feel free to reach out to me with any questions; more information is available on the SharkCharts website and the SharkCharts discord discord.gg/YVpTeSK
면책사항
해당 정보와 게시물은 금융, 투자, 트레이딩 또는 기타 유형의 조언이나 권장 사항으로 간주되지 않으며, 트레이딩뷰에서 제공하거나 보증하는 것이 아닙니다. 자세한 내용은 이용 약관을 참조하세요.
초대 전용 스크립트
이 스크립트는 작성자가 승인한 사용자만 접근할 수 있습니다. 사용하려면 요청 후 승인을 받아야 하며, 일반적으로 결제 후에 허가가 부여됩니다. 자세한 내용은 아래 작성자의 안내를 따르거나 acatwithcharts에게 직접 문의하세요.
트레이딩뷰는 스크립트의 작동 방식을 충분히 이해하고 작성자를 완전히 신뢰하지 않는 이상, 해당 스크립트에 비용을 지불하거나 사용하는 것을 권장하지 않습니다. 커뮤니티 스크립트에서 무료 오픈소스 대안을 찾아보실 수도 있습니다.
작성자 지시 사항
My volatility-based indicators are available for sale at SharkCharts.live
Feel free to reach out to me with any questions; more information is available on the SharkCharts website and the SharkCharts discord discord.gg/YVpTeSK
Feel free to reach out to me with any questions; more information is available on the SharkCharts website and the SharkCharts discord discord.gg/YVpTeSK
면책사항
해당 정보와 게시물은 금융, 투자, 트레이딩 또는 기타 유형의 조언이나 권장 사항으로 간주되지 않으며, 트레이딩뷰에서 제공하거나 보증하는 것이 아닙니다. 자세한 내용은 이용 약관을 참조하세요.