OPEN-SOURCE SCRIPT
Price equilibrium between buyers and sellers [Soroush Rezaei]
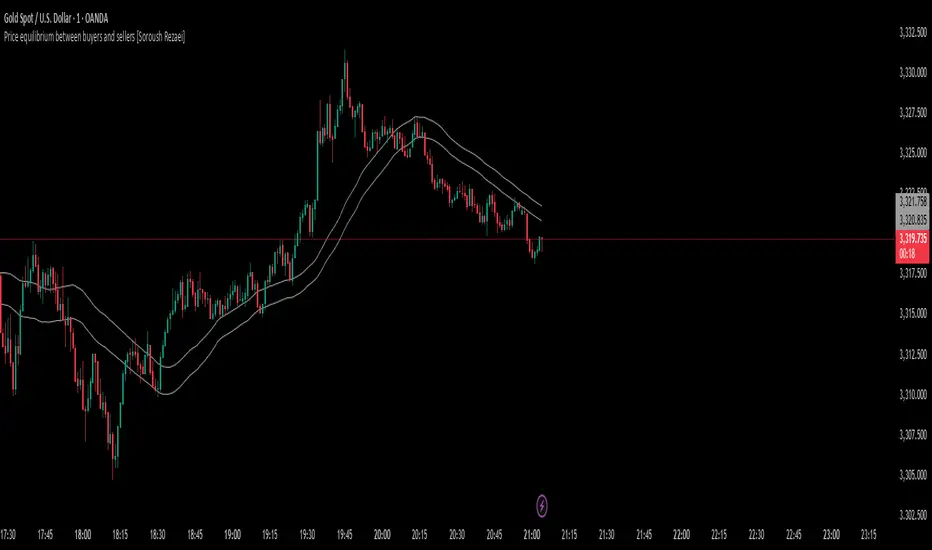
This indicator visualizes the dynamic balance between buyers and sellers using two simple moving averages (SMAs) based on the high and low prices.
The green line (SMA of highs) reflects the upper pressure zone, while the red line (SMA of lows) represents the lower support zone.
When price hovers between these two levels, it often signals a state of temporary equilibrium — a consolidation zone where buyers and sellers are relatively balanced.
Use this tool to:
Recommended for intraday and swing traders seeking visual clarity on market structure and momentum zones.
The green line (SMA of highs) reflects the upper pressure zone, while the red line (SMA of lows) represents the lower support zone.
When price hovers between these two levels, it often signals a state of temporary equilibrium — a consolidation zone where buyers and sellers are relatively balanced.
Use this tool to:
- Identify ranging or balanced market phases
- Spot potential breakout or reversal zones
- Enhance your multi-timeframe or price action strategy
Recommended for intraday and swing traders seeking visual clarity on market structure and momentum zones.
오픈 소스 스크립트
트레이딩뷰의 진정한 정신에 따라, 이 스크립트의 작성자는 이를 오픈소스로 공개하여 트레이더들이 기능을 검토하고 검증할 수 있도록 했습니다. 작성자에게 찬사를 보냅니다! 이 코드는 무료로 사용할 수 있지만, 코드를 재게시하는 경우 하우스 룰이 적용된다는 점을 기억하세요.
면책사항
해당 정보와 게시물은 금융, 투자, 트레이딩 또는 기타 유형의 조언이나 권장 사항으로 간주되지 않으며, 트레이딩뷰에서 제공하거나 보증하는 것이 아닙니다. 자세한 내용은 이용 약관을 참조하세요.
오픈 소스 스크립트
트레이딩뷰의 진정한 정신에 따라, 이 스크립트의 작성자는 이를 오픈소스로 공개하여 트레이더들이 기능을 검토하고 검증할 수 있도록 했습니다. 작성자에게 찬사를 보냅니다! 이 코드는 무료로 사용할 수 있지만, 코드를 재게시하는 경우 하우스 룰이 적용된다는 점을 기억하세요.
면책사항
해당 정보와 게시물은 금융, 투자, 트레이딩 또는 기타 유형의 조언이나 권장 사항으로 간주되지 않으며, 트레이딩뷰에서 제공하거나 보증하는 것이 아닙니다. 자세한 내용은 이용 약관을 참조하세요.