PROTECTED SOURCE SCRIPT
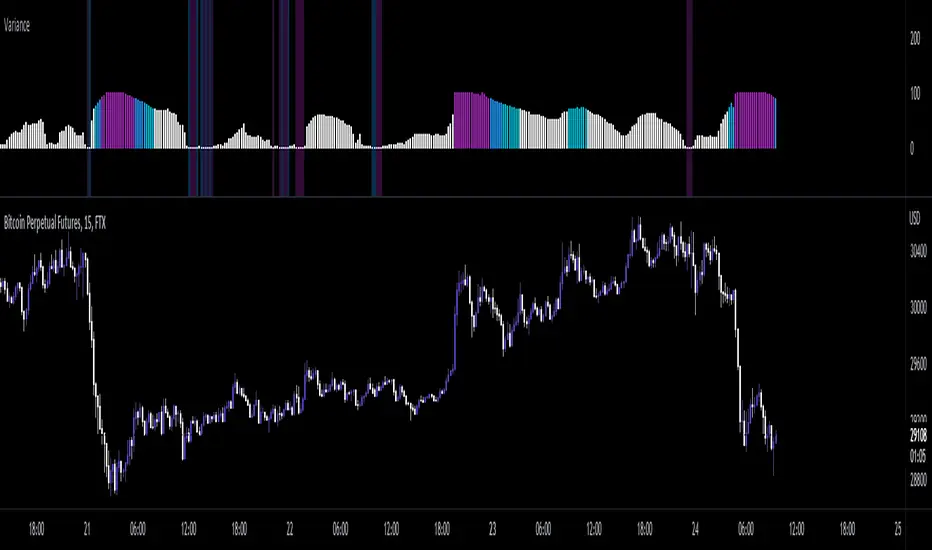
Variance Percentile
As repeated from my Variance Z-Score Script:
"Variance is a measure of dispersion, simply put, it is measuring how distant data is from it's mean(average). This indicator allows you to see when variance is increasing or decreasing, as well as when it is at an extreme value. Thru this, you can get a more accurate description of risk. When variance is increasing/high, you know to expect larger moves, as data(price) is far and getting farther from the mean. and when it is low/decreasing, you know that price movement is more likely to be less volatile due to data clustering closer to the mean, ie ; smaller values."
With Variance Percentile, we apply a percent rank function to get some statistical context from raw variance data. Used the same as my pervious Historical volatility indicator, it shows what % of historical data was less than or equal to the current value, allowing us to find point where variance is statistically likely to increase, as well as when it is at an extreme.
Recommended to paired with Historical volatility or Volatility Z-score to assist in establishing a more accurate estimation of market volatility
보호된 스크립트입니다
이 스크립트는 비공개 소스로 게시됩니다. 하지만 이를 자유롭게 제한 없이 사용할 수 있습니다 – 자세한 내용은 여기에서 확인하세요.
면책사항
해당 정보와 게시물은 금융, 투자, 트레이딩 또는 기타 유형의 조언이나 권장 사항으로 간주되지 않으며, 트레이딩뷰에서 제공하거나 보증하는 것이 아닙니다. 자세한 내용은 이용 약관을 참조하세요.
보호된 스크립트입니다
이 스크립트는 비공개 소스로 게시됩니다. 하지만 이를 자유롭게 제한 없이 사용할 수 있습니다 – 자세한 내용은 여기에서 확인하세요.
면책사항
해당 정보와 게시물은 금융, 투자, 트레이딩 또는 기타 유형의 조언이나 권장 사항으로 간주되지 않으며, 트레이딩뷰에서 제공하거나 보증하는 것이 아닙니다. 자세한 내용은 이용 약관을 참조하세요.