PROTECTED SOURCE SCRIPT
업데이트됨 GreyPool VSA Spread/Wick Divergence Indicator
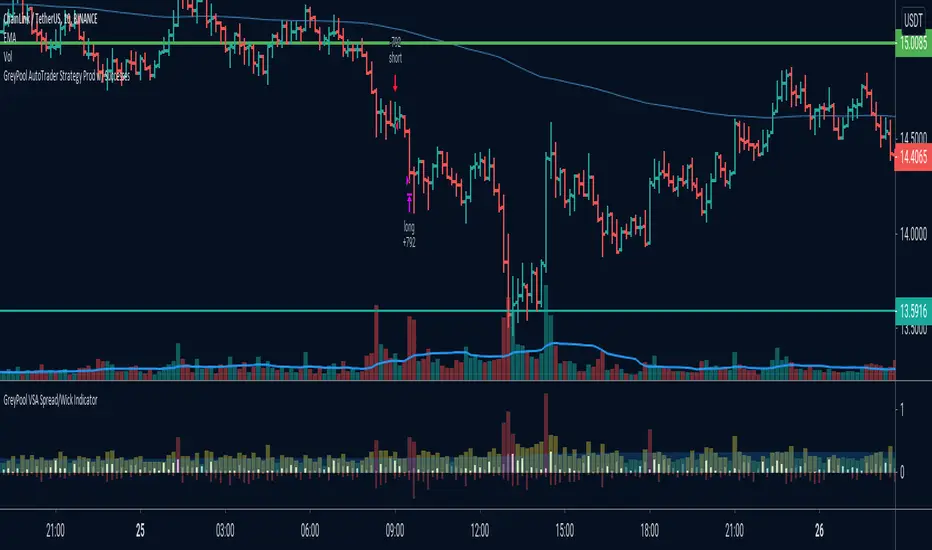
The purpose of this indicator is to determine the distance between the spread of a bar/candle and the wick at a glance (Spread is defined as the range between the open and close and the wick is any part of the bar/candle that is beyond that range).
Climactic action bars typically have large spreads and a pronounced wick which indicates hidden buying or selling.
Definitions of Colors:
Light Blue Area - Average spread size of the last x bars where x is the set MA period
Red Column - Indicates a very high spread that is far beyond the average
Yellow Column - Indicates spreads that are at the average line or just above it
Green Column - Indicates a very low spread
Thin Red Histogram - Indicates the size of the bottom wick (Either the distance between the close and low of down bars or the open and low or up bars)
Thin Blue Histogram - Indicates the size of the top wick (Either the distance between the open and high for down bars or the close and high for up bars)
*** Please Click The LIKE Button to Support Us, Thank You ***
릴리즈 노트
Changed "Thin Blue Histogram" line to whiteUsage:
More or less like a spread Delta, there is the possibility of looking at "trending" spread changes. For example, if the last 50 bars shows up bars with longer wicks and spreads and down bars with shorter wicks and smaller spreads it could be deduced that there is less resistance to the down side
릴리즈 노트
Added the ability to switch between the spread calculated as the difference between high and low or the difference between close and open릴리즈 노트
Changed default Spread option to H-L보호된 스크립트입니다
이 스크립트는 비공개 소스로 게시됩니다. 하지만 이를 자유롭게 제한 없이 사용할 수 있습니다 – 자세한 내용은 여기에서 확인하세요.
GreyPool.io
Try our automated trading strategies at: greypool.io
Try our automated trading strategies at: greypool.io
면책사항
해당 정보와 게시물은 금융, 투자, 트레이딩 또는 기타 유형의 조언이나 권장 사항으로 간주되지 않으며, 트레이딩뷰에서 제공하거나 보증하는 것이 아닙니다. 자세한 내용은 이용 약관을 참조하세요.
보호된 스크립트입니다
이 스크립트는 비공개 소스로 게시됩니다. 하지만 이를 자유롭게 제한 없이 사용할 수 있습니다 – 자세한 내용은 여기에서 확인하세요.
GreyPool.io
Try our automated trading strategies at: greypool.io
Try our automated trading strategies at: greypool.io
면책사항
해당 정보와 게시물은 금융, 투자, 트레이딩 또는 기타 유형의 조언이나 권장 사항으로 간주되지 않으며, 트레이딩뷰에서 제공하거나 보증하는 것이 아닙니다. 자세한 내용은 이용 약관을 참조하세요.