OPEN-SOURCE SCRIPT
업데이트됨 Average Range Targets
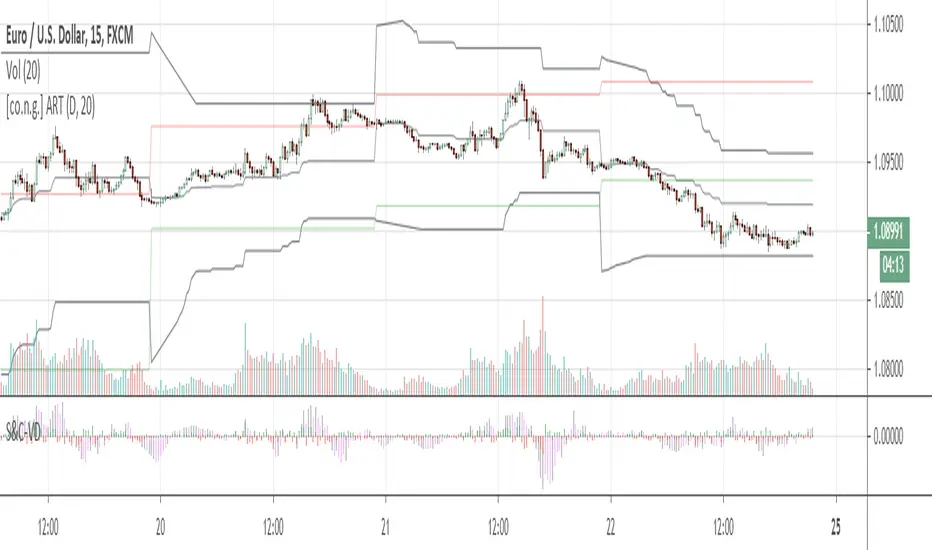
This super simple script helps spotting possible turnarounds and targets on intraday level.
The average daily range is calculated over a period of 20 days, which is approximately a trading month.
The black lines indicate the upper and lower range targets, moving closer with each new intrady high and low.
As you might recognize, in most cases the price is about to turn when one range target is hit.
The red and green lines are showing previous day's high and low as referneces.
Enjoy!
Warm regards,
Constantine Trading
릴리즈 노트
Slimmed the script and sped up calculations, fixed plotting errors.1st:
I've added a midrange level. Usually, if price is below midrange, action is suppoes to be short;
if price is above otherwise.
2nd:
Most of the time price bounces once from range target level. If it reaches a second time, chances of breaking through are high.
HINT!
Don't rely solely on this script always watch out for a proper price action setup! Consider trend direction!
오픈 소스 스크립트
트레이딩뷰의 진정한 정신에 따라, 이 스크립트의 작성자는 이를 오픈소스로 공개하여 트레이더들이 기능을 검토하고 검증할 수 있도록 했습니다. 작성자에게 찬사를 보냅니다! 이 코드는 무료로 사용할 수 있지만, 코드를 재게시하는 경우 하우스 룰이 적용된다는 점을 기억하세요.
면책사항
해당 정보와 게시물은 금융, 투자, 트레이딩 또는 기타 유형의 조언이나 권장 사항으로 간주되지 않으며, 트레이딩뷰에서 제공하거나 보증하는 것이 아닙니다. 자세한 내용은 이용 약관을 참조하세요.
오픈 소스 스크립트
트레이딩뷰의 진정한 정신에 따라, 이 스크립트의 작성자는 이를 오픈소스로 공개하여 트레이더들이 기능을 검토하고 검증할 수 있도록 했습니다. 작성자에게 찬사를 보냅니다! 이 코드는 무료로 사용할 수 있지만, 코드를 재게시하는 경우 하우스 룰이 적용된다는 점을 기억하세요.
면책사항
해당 정보와 게시물은 금융, 투자, 트레이딩 또는 기타 유형의 조언이나 권장 사항으로 간주되지 않으며, 트레이딩뷰에서 제공하거나 보증하는 것이 아닙니다. 자세한 내용은 이용 약관을 참조하세요.