OPEN-SOURCE SCRIPT
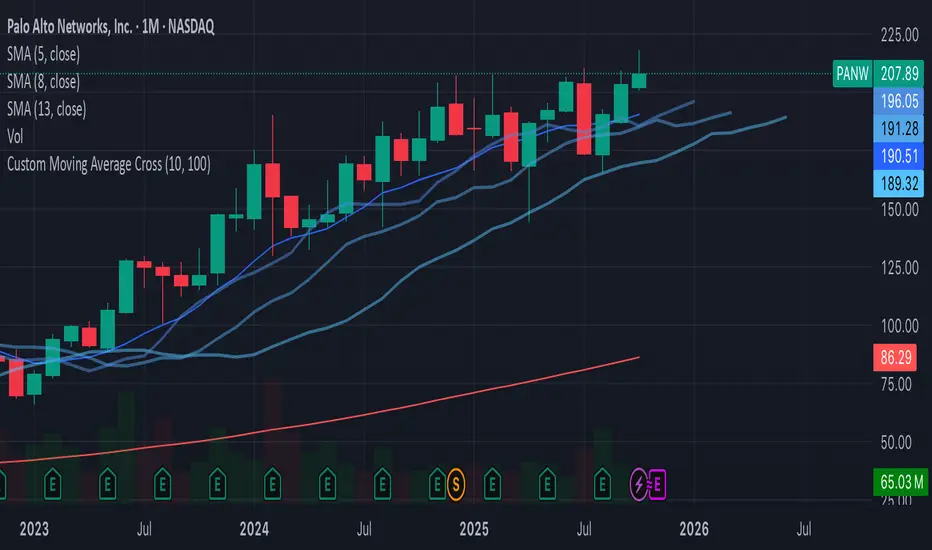
Custom Moving Average Cross - White
//version=5
indicator("Custom Moving Average Cross", overlay=true)
// User-defined parameters for moving averages
short_period = input.int(10, title="Short Period", minval=1)
long_period = input.int(100, title="Long Period", minval=1)
// Calculate the moving averages
short_ma = ta.sma(close, short_period)
long_ma = ta.sma(close, long_period)
// Plot the moving averages
plot(short_ma, color=color.blue, title="Short MA")
plot(long_ma, color=color.red, title="Long MA")
// Define the buy and sell conditions based on crossovers
buy_signal = ta.crossover(short_ma, long_ma)
sell_signal = ta.crossunder(short_ma, long_ma)
// Plot the buy and sell signals with labels (white text)
plotshape(buy_signal, location=location.belowbar, color=color.green, style=shape.labelup, title="Buy Signal", text="BUY", textcolor=color.white)
plotshape(sell_signal, location=location.abovebar, color=color.red, style=shape.labeldown, title="Sell Signal", text="SELL", textcolor=color.white)
// Optional: Background color to highlight the signals
bgcolor(buy_signal ? color.new(color.green, 90) : na, title="Buy Signal Background")
bgcolor(sell_signal ? color.new(color.red, 90) : na, title="Sell Signal Background")
오픈 소스 스크립트
진정한 트레이딩뷰 정신에 따라 이 스크립트 작성자는 트레이더가 기능을 검토하고 검증할 수 있도록 오픈소스로 공개했습니다. 작성자에게 찬사를 보냅니다! 무료로 사용할 수 있지만 코드를 다시 게시할 경우 하우스 룰이 적용된다는 점을 기억하세요.
면책사항
이 정보와 게시물은 TradingView에서 제공하거나 보증하는 금융, 투자, 거래 또는 기타 유형의 조언이나 권고 사항을 의미하거나 구성하지 않습니다. 자세한 내용은 이용 약관을 참고하세요.
오픈 소스 스크립트
진정한 트레이딩뷰 정신에 따라 이 스크립트 작성자는 트레이더가 기능을 검토하고 검증할 수 있도록 오픈소스로 공개했습니다. 작성자에게 찬사를 보냅니다! 무료로 사용할 수 있지만 코드를 다시 게시할 경우 하우스 룰이 적용된다는 점을 기억하세요.
면책사항
이 정보와 게시물은 TradingView에서 제공하거나 보증하는 금융, 투자, 거래 또는 기타 유형의 조언이나 권고 사항을 의미하거나 구성하지 않습니다. 자세한 내용은 이용 약관을 참고하세요.