PROTECTED SOURCE SCRIPT
업데이트됨 Kitaec MADIV (MAp of DIVergences)
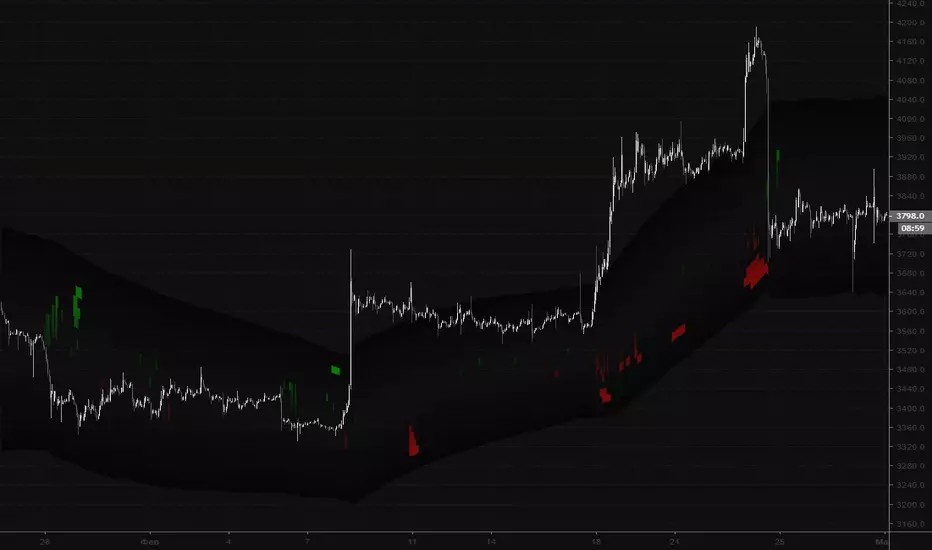
Map of RSI divergences part one. Must be used with MADIV2 (its a part 2 of this script). Showing Bullish and bearish divergences from different timeframes on the chart. Timeframes for full script are: 5m-15m-30m-1h-2h-4h-6h-8h-12h-1d. This part is from 5m to 2h. Second part is 4h-1d.
릴리즈 노트
Map of RSI divergencies for 5m to 1D timeframes shown in a form of map. Updated to the PineScript v6.보호된 스크립트입니다
이 스크립트는 비공개 소스로 게시됩니다. 하지만 이를 자유롭게 제한 없이 사용할 수 있습니다 – 자세한 내용은 여기에서 확인하세요.
면책사항
해당 정보와 게시물은 금융, 투자, 트레이딩 또는 기타 유형의 조언이나 권장 사항으로 간주되지 않으며, 트레이딩뷰에서 제공하거나 보증하는 것이 아닙니다. 자세한 내용은 이용 약관을 참조하세요.
면책사항
해당 정보와 게시물은 금융, 투자, 트레이딩 또는 기타 유형의 조언이나 권장 사항으로 간주되지 않으며, 트레이딩뷰에서 제공하거나 보증하는 것이 아닙니다. 자세한 내용은 이용 약관을 참조하세요.