OPEN-SOURCE SCRIPT
업데이트됨 Linear Regression Forecast Tool [Daveatt]
Hello traders,
Navigating through the financial markets requires a blend of analysis, insight, and a touch of foresight.
My Linear Regression Forecast Tool is here to add that touch of foresight to your analysis toolkit on TradingView!
Linear Regression is the heart of this tool, a statistical method that explores the relationship between a dependent variable and one (or more) independent variable(s).
In simpler terms, it finds a straight line that best fits a set of data points.
This "line of best fit" then becomes a visual representation of the relationship in the data, providing a basis for making predictions.
Here's what the Linear Regression Forecast Tool brings to your trading table:
Multiple Indicator Choices: Select from various market indicators like Simple Moving Averages, Bollinger Bands, or the Volume Weighted Average Price as the basis for your linear regression analysis.
Customizable Forecast Periods: Define how many periods ahead you want to forecast, adjusting to your analysis needs, whether that's looking 5, 7, or 10 periods into the future.
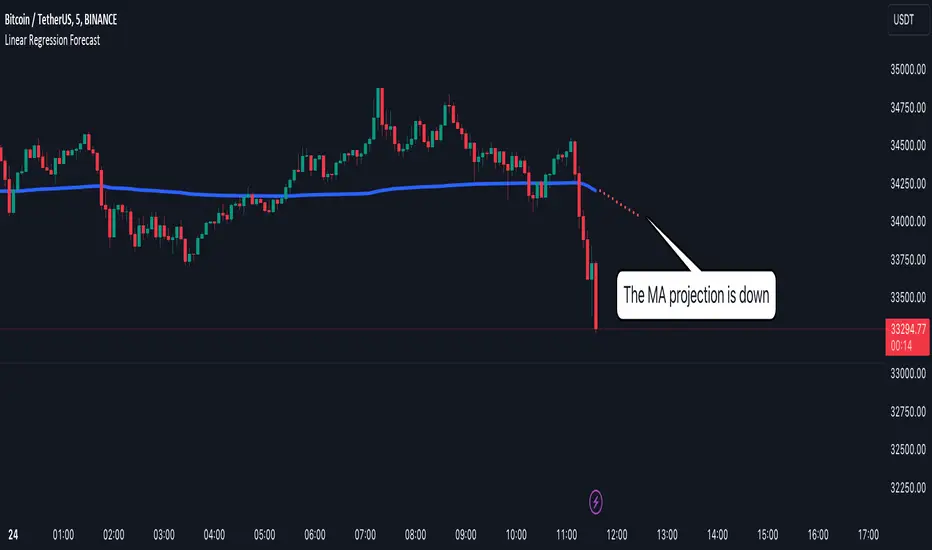
On-Chart Forecast Points: The tool plots the forecasted points on your chart, providing a straightforward visual representation of potential future values based on past data.
In this script:
1. We first calculate the indicator using the specified period.
2. We then use the ta.linreg function to calculate a linear regression curve fitted to the indicator over the last Period bars.
3. We calculate the slope of the linear regression curve using the last two points on the curve.
We use this slope to extrapolate the linear regression curve to forecast the next X points of the indicator.
4/ Finally, we use the plot function to plot the original indicator and the forecasted points on the chart, using the offset parameter to shift the forecasted points to the right (into the future).
This method assumes that the trend represented by the linear regression curve will continue, which may not always be the case, especially in volatile or changing market conditions.
Examples:
Works with a moving average

Works with a Bollinger band

The code can be adapted to work with any other indicator (imagine RSI, MACD, other Moving Average Type, PSAR, Supertrend, etc...)
Conclusion
The Linear Regression Forecast Tool doesn't promise to tell the future but provides a structured way to visualize possible future price trends based on historical data. I
Remember, no tool can predict market conditions with certainty.
It's always advisable to corroborate findings with other analysis methods and stay updated with market news and events.
Happy trading!
Navigating through the financial markets requires a blend of analysis, insight, and a touch of foresight.
My Linear Regression Forecast Tool is here to add that touch of foresight to your analysis toolkit on TradingView!
Linear Regression is the heart of this tool, a statistical method that explores the relationship between a dependent variable and one (or more) independent variable(s).
In simpler terms, it finds a straight line that best fits a set of data points.
This "line of best fit" then becomes a visual representation of the relationship in the data, providing a basis for making predictions.
Here's what the Linear Regression Forecast Tool brings to your trading table:
Multiple Indicator Choices: Select from various market indicators like Simple Moving Averages, Bollinger Bands, or the Volume Weighted Average Price as the basis for your linear regression analysis.
Customizable Forecast Periods: Define how many periods ahead you want to forecast, adjusting to your analysis needs, whether that's looking 5, 7, or 10 periods into the future.
On-Chart Forecast Points: The tool plots the forecasted points on your chart, providing a straightforward visual representation of potential future values based on past data.
In this script:
1. We first calculate the indicator using the specified period.
2. We then use the ta.linreg function to calculate a linear regression curve fitted to the indicator over the last Period bars.
3. We calculate the slope of the linear regression curve using the last two points on the curve.
We use this slope to extrapolate the linear regression curve to forecast the next X points of the indicator.
4/ Finally, we use the plot function to plot the original indicator and the forecasted points on the chart, using the offset parameter to shift the forecasted points to the right (into the future).
This method assumes that the trend represented by the linear regression curve will continue, which may not always be the case, especially in volatile or changing market conditions.
Examples:
Works with a moving average
Works with a Bollinger band
The code can be adapted to work with any other indicator (imagine RSI, MACD, other Moving Average Type, PSAR, Supertrend, etc...)
Conclusion
The Linear Regression Forecast Tool doesn't promise to tell the future but provides a structured way to visualize possible future price trends based on historical data. I
Remember, no tool can predict market conditions with certainty.
It's always advisable to corroborate findings with other analysis methods and stay updated with market news and events.
Happy trading!
릴리즈 노트
Updating the chart from this post오픈 소스 스크립트
트레이딩뷰의 진정한 정신에 따라, 이 스크립트의 작성자는 이를 오픈소스로 공개하여 트레이더들이 기능을 검토하고 검증할 수 있도록 했습니다. 작성자에게 찬사를 보냅니다! 이 코드는 무료로 사용할 수 있지만, 코드를 재게시하는 경우 하우스 룰이 적용된다는 점을 기억하세요.
⭐️ I'm looking to sell Best Trading Indicator. DM me if interested
⭐️ Listed as an Official TradingView Trusted TOP Pine Programmer
📧 Coding/Consulting Inquiries: dave@best-trading-indicator.com
⏩ Course: best-trading-indicator.com
⭐️ Listed as an Official TradingView Trusted TOP Pine Programmer
📧 Coding/Consulting Inquiries: dave@best-trading-indicator.com
⏩ Course: best-trading-indicator.com
면책사항
해당 정보와 게시물은 금융, 투자, 트레이딩 또는 기타 유형의 조언이나 권장 사항으로 간주되지 않으며, 트레이딩뷰에서 제공하거나 보증하는 것이 아닙니다. 자세한 내용은 이용 약관을 참조하세요.
오픈 소스 스크립트
트레이딩뷰의 진정한 정신에 따라, 이 스크립트의 작성자는 이를 오픈소스로 공개하여 트레이더들이 기능을 검토하고 검증할 수 있도록 했습니다. 작성자에게 찬사를 보냅니다! 이 코드는 무료로 사용할 수 있지만, 코드를 재게시하는 경우 하우스 룰이 적용된다는 점을 기억하세요.
⭐️ I'm looking to sell Best Trading Indicator. DM me if interested
⭐️ Listed as an Official TradingView Trusted TOP Pine Programmer
📧 Coding/Consulting Inquiries: dave@best-trading-indicator.com
⏩ Course: best-trading-indicator.com
⭐️ Listed as an Official TradingView Trusted TOP Pine Programmer
📧 Coding/Consulting Inquiries: dave@best-trading-indicator.com
⏩ Course: best-trading-indicator.com
면책사항
해당 정보와 게시물은 금융, 투자, 트레이딩 또는 기타 유형의 조언이나 권장 사항으로 간주되지 않으며, 트레이딩뷰에서 제공하거나 보증하는 것이 아닙니다. 자세한 내용은 이용 약관을 참조하세요.