OPEN-SOURCE SCRIPT
Buy/Sell Volume Tracker [wjdtks255]
Indicator Description
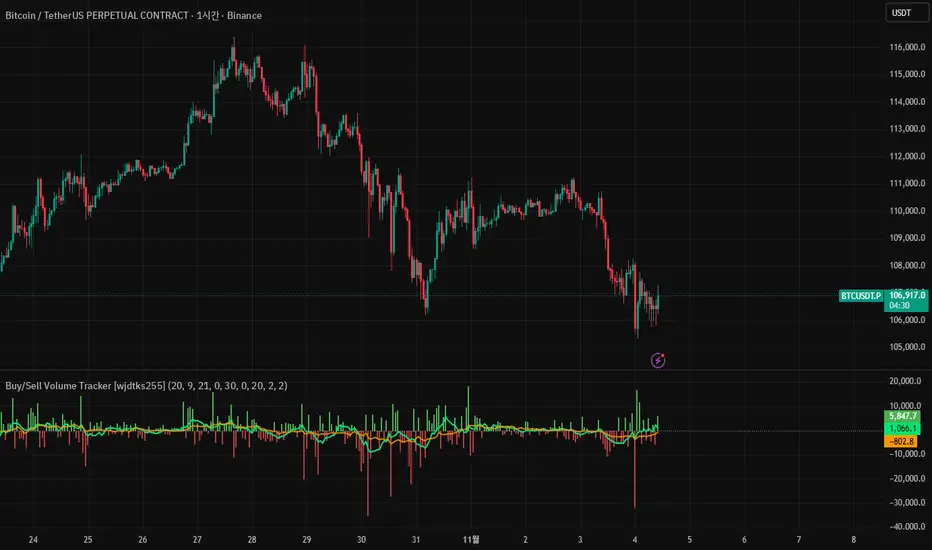
Function: Separates buy and sell volume based on candle direction (close ≥ open) and displays the buy−sell difference (hist_val) as a histogram.
Visuals: Buy/sell bars are distinguished by user-selectable colors and opacity; two moving averages (MA1 and MA2) are shown to smooth the flow.
Meaning: A positive histogram indicates buy dominance; a negative histogram indicates sell dominance.
Limitation: The current separation is estimated from candle direction and may differ from execution-side (tick/trade-side) based data.
Trading Rules (Summary)
Conservative trend-following long
Entry: Enter long when hist_val turns above 0 and MA1 crosses MA2 from below.
Stop-loss: Exit if hist_val falls back below 0 or MA1 drops below MA2.
Take-profit: Use a risk:reward of 1:1.5 or set targets based on ATR.
Short-term rebound long
Entry: Enter a short-term long when a large negative histogram region begins to narrow and shows a recovery sign.
Stop-loss: Exit if hist_val drops below the previous low or bearish candles continue.
Take-profit: Prefer quick partial profit-taking.
Short (sell) strategy
Entry: Enter short when hist_val falls below 0 and MA1 crosses MA2 from above.
Stop-loss / Take-profit: Apply the inverse rules of the long strategy.
Filters and risk management
Volume filter: Only accept signals when volume exceeds a fraction of average volume to reduce noise.
Entry strength: Require |hist_val| to exceed a historical average threshold (e.g., avg(|hist_val|, N) × factor) to strengthen signals.
Position sizing: Size positions so that account risk per trade is within limits (e.g., 1–2% of account equity).
Timeframe: Use short timeframes for scalping and 1h+ for swing trading.
오픈 소스 스크립트
진정한 트레이딩뷰 정신에 따라 이 스크립트 작성자는 트레이더가 기능을 검토하고 검증할 수 있도록 오픈소스로 공개했습니다. 작성자에게 찬사를 보냅니다! 무료로 사용할 수 있지만 코드를 다시 게시할 경우 하우스 룰이 적용된다는 점을 기억하세요.
면책사항
이 정보와 게시물은 TradingView에서 제공하거나 보증하는 금융, 투자, 거래 또는 기타 유형의 조언이나 권고 사항을 의미하거나 구성하지 않습니다. 자세한 내용은 이용 약관을 참고하세요.
오픈 소스 스크립트
진정한 트레이딩뷰 정신에 따라 이 스크립트 작성자는 트레이더가 기능을 검토하고 검증할 수 있도록 오픈소스로 공개했습니다. 작성자에게 찬사를 보냅니다! 무료로 사용할 수 있지만 코드를 다시 게시할 경우 하우스 룰이 적용된다는 점을 기억하세요.
면책사항
이 정보와 게시물은 TradingView에서 제공하거나 보증하는 금융, 투자, 거래 또는 기타 유형의 조언이나 권고 사항을 의미하거나 구성하지 않습니다. 자세한 내용은 이용 약관을 참고하세요.