PROTECTED SOURCE SCRIPT
Trend Ribbon
---------- INTRODUCTION ----------
Ribbon indicator is a trend indicator based on Moving Average
Default setting is 20 WMA
---------- HOW TO READ? ----------
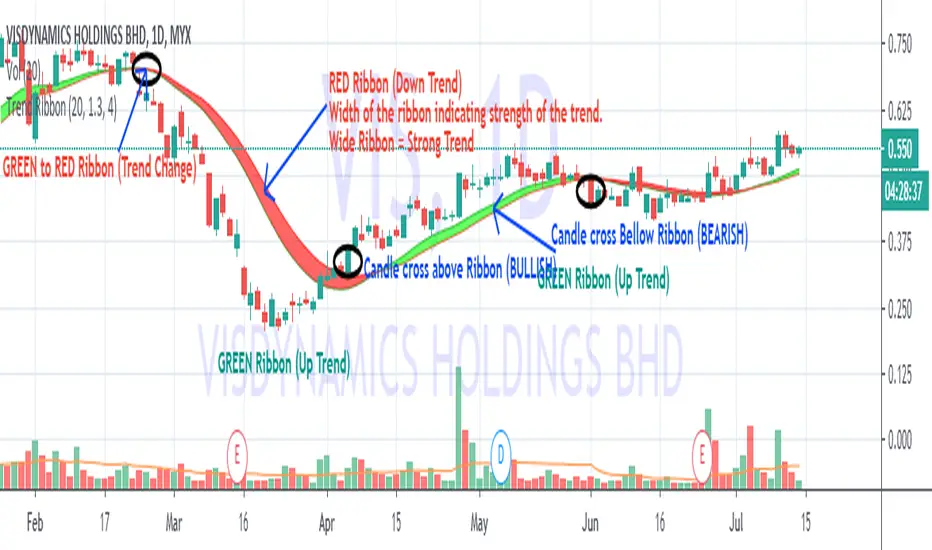
Color
GREEN RIBBON = UP TREND (Short Term EMA above Long EMA )
RED RIBBON = DOWN TREND (Short Term EMA below Long EMA )
Candle's Position
Candle above ribbon = BULLISH
Candle below ribbon = BEARISH
Width
Width of the Ribbon is indicating the strength of the trend.
Wider ribbon indicating STRONG trend.
Thin ribbon indicating WEAK trend. May indicating Ranging.
---------- HOW TO TRADE? ----------
Only BUY when BULLISH and UPTREND
Avoid trading when ranging.
NOTES:-
Use with other indicators like FiFT or MCDX to measure the strength of the BULL .
Review Global Indices to feel Global market direction to support our trading decision
Ribbon indicator is a trend indicator based on Moving Average
Default setting is 20 WMA
---------- HOW TO READ? ----------
Color
GREEN RIBBON = UP TREND (Short Term EMA above Long EMA )
RED RIBBON = DOWN TREND (Short Term EMA below Long EMA )
Candle's Position
Candle above ribbon = BULLISH
Candle below ribbon = BEARISH
Width
Width of the Ribbon is indicating the strength of the trend.
Wider ribbon indicating STRONG trend.
Thin ribbon indicating WEAK trend. May indicating Ranging.
---------- HOW TO TRADE? ----------
Only BUY when BULLISH and UPTREND
Avoid trading when ranging.
NOTES:-
Use with other indicators like FiFT or MCDX to measure the strength of the BULL .
Review Global Indices to feel Global market direction to support our trading decision
보호된 스크립트입니다
이 스크립트는 비공개 소스로 게시됩니다. 하지만 이를 자유롭게 제한 없이 사용할 수 있습니다 – 자세한 내용은 여기에서 확인하세요.
Contact me to learn Turtle Trading System, MCDX and other indicators (t.me/SgxFx)
tradingview.com/script/mbiUr95n-MCDX-Plus/
tradingview.com/script/mcAidXIT-FiFT-Pro/
tradingview.com/script/viAR3Ilo-Trend-Sign
tradingview.com/script/mbiUr95n-MCDX-Plus/
tradingview.com/script/mcAidXIT-FiFT-Pro/
tradingview.com/script/viAR3Ilo-Trend-Sign
면책사항
해당 정보와 게시물은 금융, 투자, 트레이딩 또는 기타 유형의 조언이나 권장 사항으로 간주되지 않으며, 트레이딩뷰에서 제공하거나 보증하는 것이 아닙니다. 자세한 내용은 이용 약관을 참조하세요.