OPEN-SOURCE SCRIPT
Ninja Trend v2
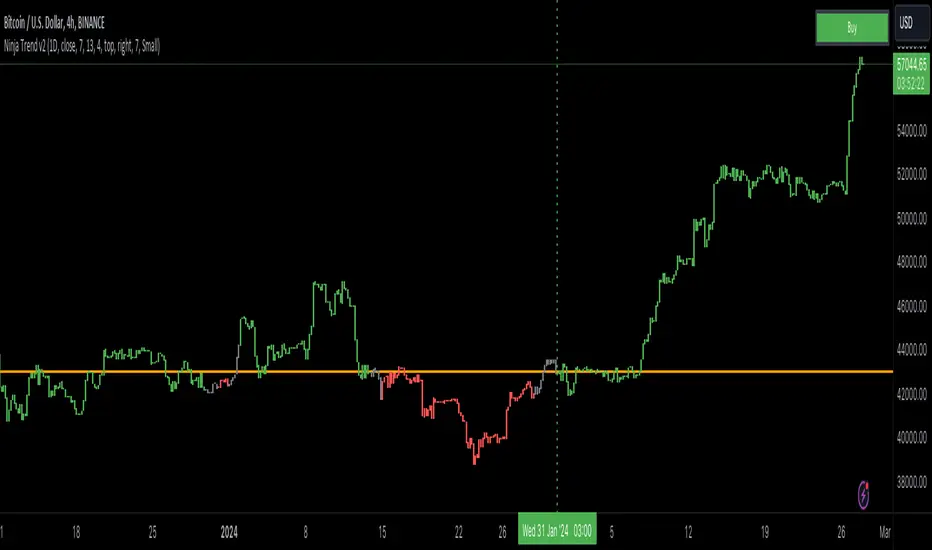
Ninja Trend V2 is best for swing, day trading and scalping using higher timeframe bias and executing in the lower timeframes. Uses MACD for the overall bias and paints a Heikin-Ashi chart.
Settings:
Firstly, go to chart settings, check (tick) the body, uncheck borders and wicks.
Secondly, go to the script settings and input the following;
Source close
Fast moving average 7
Slow moving average 13
Signal length 4
For day trading and scalping, change the script settings timeframe to 15 minutes and use a smaller chart timeframe (M5 or M1)
For swinging change the script settings timeframe to Daily and use H4 chart timeframe.
Behind the code:
When the higher timeframe MACD histogram crosses and closes above zero line, script goes to neutral and paints grey bars waiting for the signal line to cross and close above the zero line and then paints green bars and a buy signal is generated.
When the higher timeframe MACD histogram crosses and closes below zero line, script goes to neutral and paints grey bars waiting for the signal line to cross and close below the zero line and then paints red bars.
Advantage of this is to filter out the chart noise by painting Heikin Ashi charts.
Signals:
Grey means neutral. No entries should be made.
Red means sells only. And then hold until the trend changes to green or use your desired TP and SL.
Green means buys only. And then hold until the trend changes to red or use your desired TP and SL.
오픈 소스 스크립트
트레이딩뷰의 진정한 정신에 따라, 이 스크립트의 작성자는 이를 오픈소스로 공개하여 트레이더들이 기능을 검토하고 검증할 수 있도록 했습니다. 작성자에게 찬사를 보냅니다! 이 코드는 무료로 사용할 수 있지만, 코드를 재게시하는 경우 하우스 룰이 적용된다는 점을 기억하세요.
면책사항
해당 정보와 게시물은 금융, 투자, 트레이딩 또는 기타 유형의 조언이나 권장 사항으로 간주되지 않으며, 트레이딩뷰에서 제공하거나 보증하는 것이 아닙니다. 자세한 내용은 이용 약관을 참조하세요.
오픈 소스 스크립트
트레이딩뷰의 진정한 정신에 따라, 이 스크립트의 작성자는 이를 오픈소스로 공개하여 트레이더들이 기능을 검토하고 검증할 수 있도록 했습니다. 작성자에게 찬사를 보냅니다! 이 코드는 무료로 사용할 수 있지만, 코드를 재게시하는 경우 하우스 룰이 적용된다는 점을 기억하세요.
면책사항
해당 정보와 게시물은 금융, 투자, 트레이딩 또는 기타 유형의 조언이나 권장 사항으로 간주되지 않으며, 트레이딩뷰에서 제공하거나 보증하는 것이 아닙니다. 자세한 내용은 이용 약관을 참조하세요.