OPEN-SOURCE SCRIPT
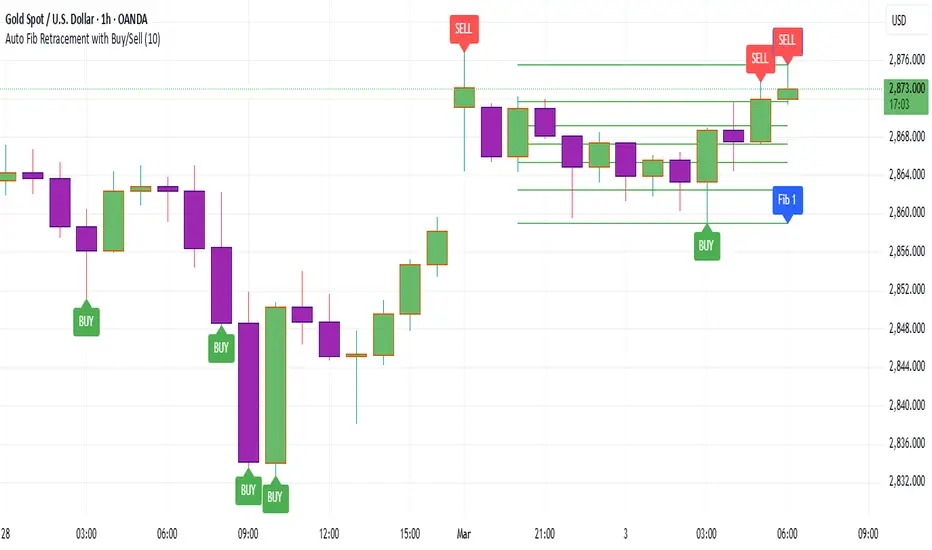
Auto Fib Retracement with Buy/Sell
Key Features of the Advanced Script:
Multi-Timeframe (MTF) Analysis:
We added an input for the higher timeframe (higher_tf), where the trend is checked on a higher timeframe to confirm the primary trend direction.
Complex Trend Detection:
The trend is determined not only by the current timeframe but also by the trend on the higher timeframe, giving a more comprehensive and reliable signal.
Dynamic Fibonacci Levels:
Fibonacci lines are plotted dynamically, extending them based on price movement, with the Fibonacci retracement drawn only when a trend is identified.
Background Color & Labels:
A background color is added to give a clear indication of the trend direction. Green for uptrend, red for downtrend. It makes it visually easier to understand the current market structure.
"Buy" or "Sell" labels are shown directly on the chart to mark possible entry points.
Strategy and Backtesting:
The script includes strategy commands (strategy.entry and strategy.exit), which allow for backtesting the strategy in TradingView.
Stop loss and take profit conditions are added (loss=100, profit=200), which can be adjusted according to your preferences.
Next Steps:
Test with different timeframes: Try changing the higher_tf to different timeframes (like "60" or "240") and see how it affects the trend detection.
Adjust Fibonacci settings: Modify how the Fibonacci levels are calculated or add more Fibonacci levels like 38.2%, 61.8%, etc.
Optimize Strategy Parameters: Fine-tune the entry/exit logic by adjusting stop loss, take profit, and other strategy parameters.
This should give you a robust foundation for creating advanced trend detection strategies
오픈 소스 스크립트
트레이딩뷰의 진정한 정신에 따라, 이 스크립트의 작성자는 이를 오픈소스로 공개하여 트레이더들이 기능을 검토하고 검증할 수 있도록 했습니다. 작성자에게 찬사를 보냅니다! 이 코드는 무료로 사용할 수 있지만, 코드를 재게시하는 경우 하우스 룰이 적용된다는 점을 기억하세요.
면책사항
해당 정보와 게시물은 금융, 투자, 트레이딩 또는 기타 유형의 조언이나 권장 사항으로 간주되지 않으며, 트레이딩뷰에서 제공하거나 보증하는 것이 아닙니다. 자세한 내용은 이용 약관을 참조하세요.
오픈 소스 스크립트
트레이딩뷰의 진정한 정신에 따라, 이 스크립트의 작성자는 이를 오픈소스로 공개하여 트레이더들이 기능을 검토하고 검증할 수 있도록 했습니다. 작성자에게 찬사를 보냅니다! 이 코드는 무료로 사용할 수 있지만, 코드를 재게시하는 경우 하우스 룰이 적용된다는 점을 기억하세요.
면책사항
해당 정보와 게시물은 금융, 투자, 트레이딩 또는 기타 유형의 조언이나 권장 사항으로 간주되지 않으며, 트레이딩뷰에서 제공하거나 보증하는 것이 아닙니다. 자세한 내용은 이용 약관을 참조하세요.