PROTECTED SOURCE SCRIPT
Choppy Market Meter x SmartBlackGirl
How It Works
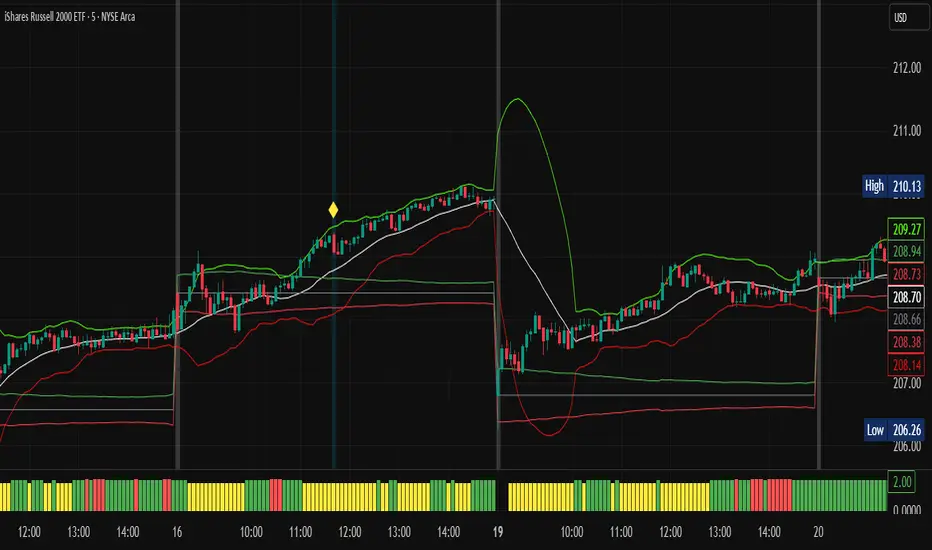
The indicator measures compression or indecision by analyzing Bollinger Band Width (BBW), volume, and price behavior. It plots a bar graph or colored meter under your chart showing:
🔴 Red (Chop Zone) – Market is consolidating or stuck in a tight range. Avoid trading.
🟡 Yellow (Transition) – Volatility may be increasing. Watch for breakouts.
🟢 Green (Breakout Zone) – Volatility has expanded, and the market is likely trending. This is the best time to trade momentum-based setups.
✅ Best Times to Trade with the Chop Meter
Wait for the bar to turn green or exit the red zone.
Confirm with other signals like:
Breakouts from Bollinger Band squeezes
Volume surge
Directional bias (e.g., from ORB box or higher timeframe trend)
Avoid trades during red chop bars, as breakouts often fail and get reversed.
Use the Chop Meter as a filter, not a signal. Combine it with your breakout or momentum strategy (e.g., BB Squeeze, ORB Box) to increase win rate and avoid trading noise.
보호된 스크립트입니다
이 스크립트는 비공개 소스로 게시됩니다. 하지만 제한 없이 자유롭게 사용할 수 있습니다 — 여기에서 자세히 알아보기.
면책사항
이 정보와 게시물은 TradingView에서 제공하거나 보증하는 금융, 투자, 거래 또는 기타 유형의 조언이나 권고 사항을 의미하거나 구성하지 않습니다. 자세한 내용은 이용 약관을 참고하세요.
보호된 스크립트입니다
이 스크립트는 비공개 소스로 게시됩니다. 하지만 제한 없이 자유롭게 사용할 수 있습니다 — 여기에서 자세히 알아보기.
면책사항
이 정보와 게시물은 TradingView에서 제공하거나 보증하는 금융, 투자, 거래 또는 기타 유형의 조언이나 권고 사항을 의미하거나 구성하지 않습니다. 자세한 내용은 이용 약관을 참고하세요.