PROTECTED SOURCE SCRIPT
업데이트됨 Sigma-Level

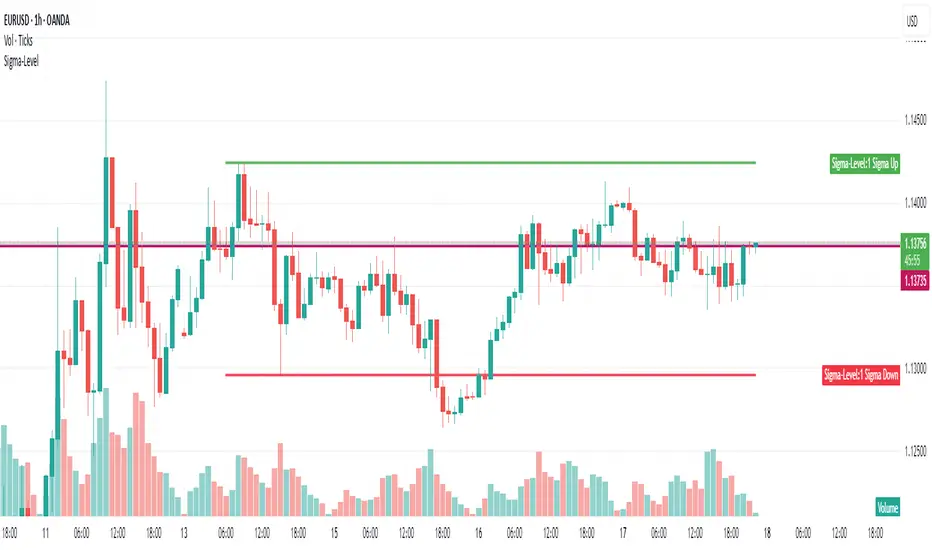
1-Sigma-Level Indicator (for 28 FX Pairs)
This TradingView indicator calculates and visualizes the 1-sigma price projection range for the current FX pair, based on implied volatility (IV) and a user-defined reference price.
🔧 User Inputs
1. Implied Volatility (IV) Selection
You can choose which volatility term to apply:
ON (Overnight)
1W (1 Week)
1M (1 Month)
Each currency pair uses manually entered IV values (in %), grouped by base currency (USD, EUR, GBP, etc.).
https://www.investing.com/currencies/forex-options
2. Base Price Selection
You can define the price level used as the anchor for the sigma projection:
CurrentPrice — live market price
YesterdayClose — close of the previous day
LastHourClose — close of the last 1-hour candle
LastFriday — weekly close from last Friday
LastMonthClose — close of the previous monthly candle
LastYearClose — close of the previous yearly candle
These values are retrieved using the appropriate timeframe (D, W, M, 12M, or 60 for hourly).
📐 How the Calculation Works
The indicator calculates the 1σ range using this formula:
1σ Range = basePrice × (IV / √N) / 100
Where:
basePrice is the selected anchor price.
IV is the selected implied volatility for the current pair.
N is the number of periods per year, depending on the IV term:
√252 for ON (trading days)
√52 for 1W (weeks)
√12 for 1M (months)
The upper and lower bands are then:
1σ Up = basePrice + range
1σ Down = basePrice - range
These bands are plotted only during the current calendar week.
🖼️ Visual Output
Green Line: 1σ Upper Boundary
Red Line: 1σ Lower Boundary
Labels show the exact 1σ values at the most recent bar
⚠️ Disclaimer
This indicator is for informational and analytical purposes only. It does not constitute financial advice, a trading signal, or a guarantee of future performance. Always perform your own research and consult with a qualified financial advisor before making trading decisions.
릴리즈 노트
Updaten Input to ON 1W and 1M릴리즈 노트
Fix Price Settings릴리즈 노트
Shrink to only ON보호된 스크립트입니다
이 스크립트는 비공개 소스로 게시됩니다. 하지만 이를 자유롭게 제한 없이 사용할 수 있습니다 – 자세한 내용은 여기에서 확인하세요.
면책사항
해당 정보와 게시물은 금융, 투자, 트레이딩 또는 기타 유형의 조언이나 권장 사항으로 간주되지 않으며, 트레이딩뷰에서 제공하거나 보증하는 것이 아닙니다. 자세한 내용은 이용 약관을 참조하세요.
보호된 스크립트입니다
이 스크립트는 비공개 소스로 게시됩니다. 하지만 이를 자유롭게 제한 없이 사용할 수 있습니다 – 자세한 내용은 여기에서 확인하세요.
면책사항
해당 정보와 게시물은 금융, 투자, 트레이딩 또는 기타 유형의 조언이나 권장 사항으로 간주되지 않으며, 트레이딩뷰에서 제공하거나 보증하는 것이 아닙니다. 자세한 내용은 이용 약관을 참조하세요.