OPEN-SOURCE SCRIPT
Vertical Line Timeline 10 Inputs by LK
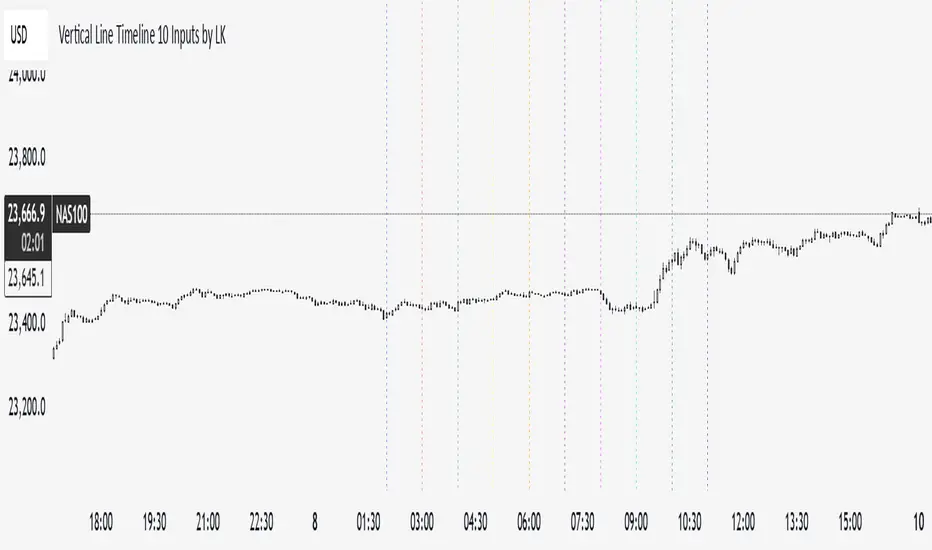
**Vertical Line Timeline (10 Inputs)**
This TradingView indicator plots vertical lines on your chart at up to **10 specific times of day**. You can define each time in **HH.MM format** (e.g., `9.30` for 9:30 AM). When the current bar’s time matches any of the defined times (based on the chart’s timezone), the indicator automatically draws a **full-height vertical line** at that bar.
**Features:**
* **Up to 10 custom time inputs** (HH.MM format)
* **Custom color** for each time marker
* **Adjustable line width** (1–6 px)
* **Solid or dotted style** toggle
* **Full-height vertical lines** (extend through the entire chart height)
* Works on any intraday timeframe where bar start times can match the defined times
* No labels or extra elements — clean and minimal display
**Use cases:**
* Marking important market sessions (e.g., London Open, New York Open, Asian Close)
* Highlighting personal trade execution windows
* Visual cues for strategy backtesting or time-based setups
오픈 소스 스크립트
트레이딩뷰의 진정한 정신에 따라, 이 스크립트의 작성자는 이를 오픈소스로 공개하여 트레이더들이 기능을 검토하고 검증할 수 있도록 했습니다. 작성자에게 찬사를 보냅니다! 이 코드는 무료로 사용할 수 있지만, 코드를 재게시하는 경우 하우스 룰이 적용된다는 점을 기억하세요.
면책사항
해당 정보와 게시물은 금융, 투자, 트레이딩 또는 기타 유형의 조언이나 권장 사항으로 간주되지 않으며, 트레이딩뷰에서 제공하거나 보증하는 것이 아닙니다. 자세한 내용은 이용 약관을 참조하세요.
오픈 소스 스크립트
트레이딩뷰의 진정한 정신에 따라, 이 스크립트의 작성자는 이를 오픈소스로 공개하여 트레이더들이 기능을 검토하고 검증할 수 있도록 했습니다. 작성자에게 찬사를 보냅니다! 이 코드는 무료로 사용할 수 있지만, 코드를 재게시하는 경우 하우스 룰이 적용된다는 점을 기억하세요.
면책사항
해당 정보와 게시물은 금융, 투자, 트레이딩 또는 기타 유형의 조언이나 권장 사항으로 간주되지 않으며, 트레이딩뷰에서 제공하거나 보증하는 것이 아닙니다. 자세한 내용은 이용 약관을 참조하세요.