OPEN-SOURCE SCRIPT
Dynamic Levels Breakouts [Angel Algo]
INTRODUCTION
The Dynamic Levels Breakouts indicator is a powerful tool designed to identify dynamic support and resistance levels in the price action. It plots these levels on the chart and provides visual signals for bullish and bearish breakouts.
FEATURES
1. Dynamic Support and Resistance Levels.
The indicator calculates the maximum (resistance) and minimum (support) price levels within the defined rolling window. The highest high and lowest low are used to identify dynamic resistance and support levels, respectively.
2. Coloring Conditions
The indicator uses conditional coloring to highlight potential support and resistance levels. When a significant level is detected, it will be colored with a transparent overlay. Red color indicates potential resistance (max_level), and green color indicates potential support (min_level).
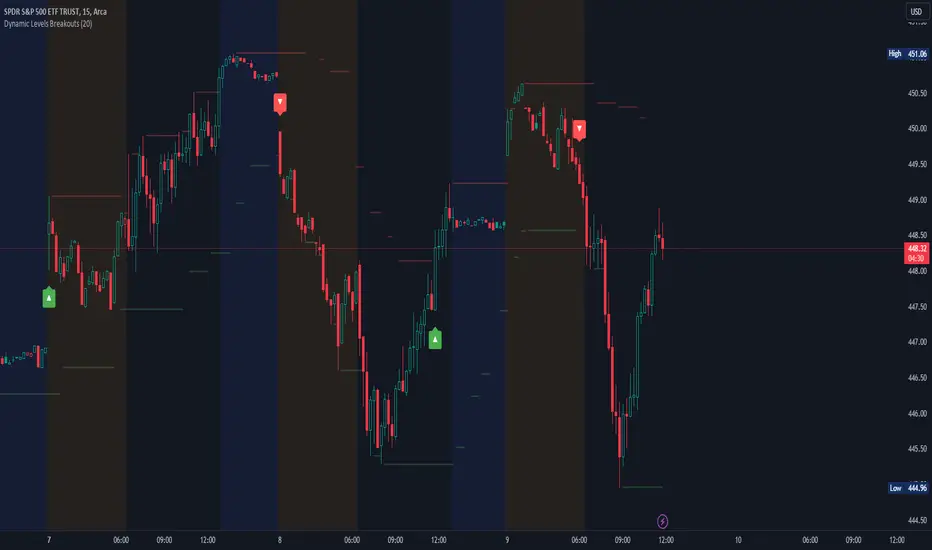
3. Bullish and Bearish Breakouts
The indicator also identifies potential bullish and bearish breakouts from the dynamic levels. A bullish breakout occurs when the closing price crosses above the dynamic resistance level (max_level). A bearish breakout occurs when the closing price crosses below the dynamic support level (min_level). The breakout signals are marked with arrow symbols (▲ for bullish and ▼ for bearish) below and above the respective bars.
4. Market Regime
To prevent multiple signals within a short period, the indicator considers the current market regime. If a bullish breakout has occurred recently, it will not generate a new bullish signal until a bearish breakout occurs, and vice versa.
HOW TO USE
The Dynamic Levels Breakouts indicator can be used to identify potential breakout trading opportunities. A bullish breakout signal (▲) suggests a potential long entry or an increase in buying pressure. A bearish breakout signal (▼) indicates a potential short entry or an increase in selling pressure. Traders can use these signals as a reference and combine them with other technical analysis tools and strategies for confirmation.
SETTINGS
Period (length): The user can adjust the "Period" input to define the rolling window for calculating the maximum and minimum price levels. The default value is 20, but it can be set anywhere between 2 and 30. A higher value may yield more significant levels but can also result in delayed signals
The Dynamic Levels Breakouts indicator is a powerful tool designed to identify dynamic support and resistance levels in the price action. It plots these levels on the chart and provides visual signals for bullish and bearish breakouts.
FEATURES
1. Dynamic Support and Resistance Levels.
The indicator calculates the maximum (resistance) and minimum (support) price levels within the defined rolling window. The highest high and lowest low are used to identify dynamic resistance and support levels, respectively.
2. Coloring Conditions
The indicator uses conditional coloring to highlight potential support and resistance levels. When a significant level is detected, it will be colored with a transparent overlay. Red color indicates potential resistance (max_level), and green color indicates potential support (min_level).
3. Bullish and Bearish Breakouts
The indicator also identifies potential bullish and bearish breakouts from the dynamic levels. A bullish breakout occurs when the closing price crosses above the dynamic resistance level (max_level). A bearish breakout occurs when the closing price crosses below the dynamic support level (min_level). The breakout signals are marked with arrow symbols (▲ for bullish and ▼ for bearish) below and above the respective bars.
4. Market Regime
To prevent multiple signals within a short period, the indicator considers the current market regime. If a bullish breakout has occurred recently, it will not generate a new bullish signal until a bearish breakout occurs, and vice versa.
HOW TO USE
The Dynamic Levels Breakouts indicator can be used to identify potential breakout trading opportunities. A bullish breakout signal (▲) suggests a potential long entry or an increase in buying pressure. A bearish breakout signal (▼) indicates a potential short entry or an increase in selling pressure. Traders can use these signals as a reference and combine them with other technical analysis tools and strategies for confirmation.
SETTINGS
Period (length): The user can adjust the "Period" input to define the rolling window for calculating the maximum and minimum price levels. The default value is 20, but it can be set anywhere between 2 and 30. A higher value may yield more significant levels but can also result in delayed signals
오픈 소스 스크립트
트레이딩뷰의 진정한 정신에 따라, 이 스크립트의 작성자는 이를 오픈소스로 공개하여 트레이더들이 기능을 검토하고 검증할 수 있도록 했습니다. 작성자에게 찬사를 보냅니다! 이 코드는 무료로 사용할 수 있지만, 코드를 재게시하는 경우 하우스 룰이 적용된다는 점을 기억하세요.
Access our exclusive tools at: angelalgo.com
Join our community via discord.gg/FGUTfkmYbW
All content from AngelAlgo is for informational and educational purposes only. Please note that past performance does not guarantee future results.
Join our community via discord.gg/FGUTfkmYbW
All content from AngelAlgo is for informational and educational purposes only. Please note that past performance does not guarantee future results.
면책사항
해당 정보와 게시물은 금융, 투자, 트레이딩 또는 기타 유형의 조언이나 권장 사항으로 간주되지 않으며, 트레이딩뷰에서 제공하거나 보증하는 것이 아닙니다. 자세한 내용은 이용 약관을 참조하세요.