OPEN-SOURCE SCRIPT
Supertrend Crosses_AIT
Supertrend Crosser
Overview:
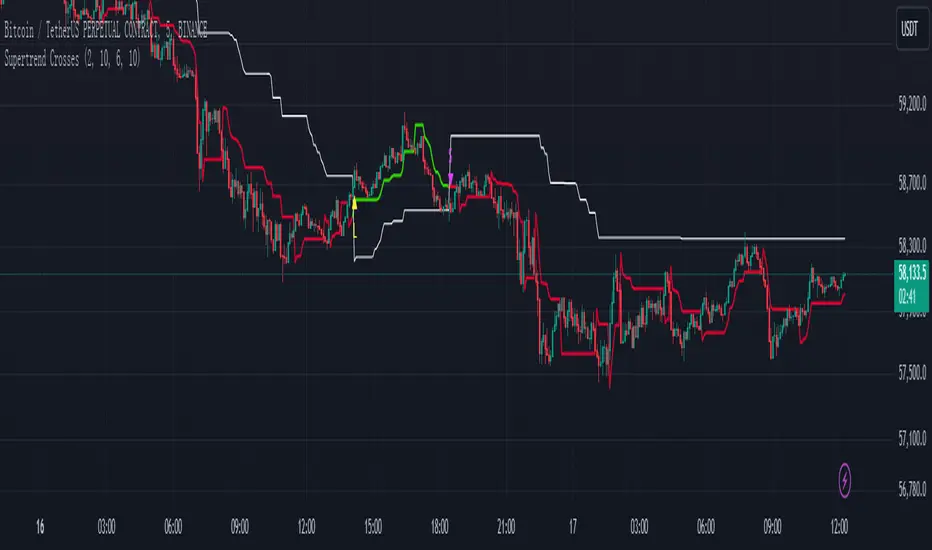
The "Supertrend Crosses" indicator is a technical analysis tool that combines two Supertrend lines with different parameters to generate buy and sell signals based on their crossovers. The indicator uses color coding to visualize the market trend and provides alerts for potential trade entries.
1. Settings and Inputs:
Supertrend A:
Factor: Multiplier for the ATR (Average True Range), which determines the sensitivity of Supertrend A.
ATR Period: Number of periods used to calculate the ATR for Supertrend A.
Supertrend B:
Factor: Multiplier for the ATR, which determines the sensitivity of Supertrend B.
ATR Period: Number of periods used to calculate the ATR for Supertrend B.
2. Indicator Components:
Supertrend A:
Plotted on the chart using dynamic coloring:
Green when Supertrend A is above Supertrend B.
Red when Supertrend A is below Supertrend B.
Supertrend B:
Plotted on the chart in white color to provide a visual reference for the crossover signals.
3. Crossover Signals:
Long Signal:
Triggered when Supertrend A crosses above Supertrend B.
A yellow upward triangle ("L") is displayed on the chart below the price bar.
Short Signal:
Triggered when Supertrend A crosses below Supertrend B.
A fuchsia downward triangle ("S") is displayed on the chart above the price bar.
4. How to Use the Indicator:
Identifying Trend Changes:
When Supertrend A crosses above Supertrend B, it indicates a potential upward trend, generating a buy signal.
Conversely, when Supertrend A crosses below Supertrend B, it suggests a potential downward trend, generating a sell signal.
Signal Visualization:
Yellow "L" markers indicate long entry points (buy signals).
Fuchsia "S" markers indicate short entry points (sell signals).
Alerts:
The indicator is equipped with alert conditions for both long and short signals. Users can set up alerts in TradingView to receive notifications when these signals occur.
5. Customization:
Supertrend Parameters:
The factors and ATR periods for Supertrend A and B can be adjusted in the settings to fit different market conditions and trading strategies.
Show Signals Option:
The user can toggle the display of the buy and sell signals on the chart through the "Show Signals?" checkbox in the settings.
6. Visual Representation:
Lines:
Supertrend A: Plotted with dynamic coloring based on its relation to Supertrend B.
Supertrend B: Plotted in white for a clear reference.
Markers:
"L" (yellow) for long signals and "S" (fuchsia) for short signals are plotted on the chart at the point of crossover.
7. Alerts Setup:
Buy Signal Alert: Alerts the user when Supertrend A crosses above Supertrend B.
Sell Signal Alert: Alerts the user when Supertrend A crosses below Supertrend B.
8. Advantages:
Simple and Effective: This indicator simplifies trend identification by using crossovers of two Supertrend lines.
Customizable: The indicator's parameters can be tailored to suit different trading styles and asset classes.
Alerts: Provides alert functionality to ensure traders do not miss trading opportunities.
9. Usage Tips:
Combine with Other Indicators: For more reliable signals, consider using this indicator in conjunction with other technical analysis tools like RSI, MACD, or support and resistance levels.
Risk Management: Always use appropriate risk management techniques, such as stop-loss orders, to protect your capital.
The "Supertrend Crosses" indicator offers a straightforward approach to identifying potential trend reversals and trade entries using the crossover of two Supertrend lines. It provides clear visual signals and alert notifications, making it a valuable tool for traders looking to incorporate trend-following strategies.
Overview:
The "Supertrend Crosses" indicator is a technical analysis tool that combines two Supertrend lines with different parameters to generate buy and sell signals based on their crossovers. The indicator uses color coding to visualize the market trend and provides alerts for potential trade entries.
1. Settings and Inputs:
Supertrend A:
Factor: Multiplier for the ATR (Average True Range), which determines the sensitivity of Supertrend A.
ATR Period: Number of periods used to calculate the ATR for Supertrend A.
Supertrend B:
Factor: Multiplier for the ATR, which determines the sensitivity of Supertrend B.
ATR Period: Number of periods used to calculate the ATR for Supertrend B.
2. Indicator Components:
Supertrend A:
Plotted on the chart using dynamic coloring:
Green when Supertrend A is above Supertrend B.
Red when Supertrend A is below Supertrend B.
Supertrend B:
Plotted on the chart in white color to provide a visual reference for the crossover signals.
3. Crossover Signals:
Long Signal:
Triggered when Supertrend A crosses above Supertrend B.
A yellow upward triangle ("L") is displayed on the chart below the price bar.
Short Signal:
Triggered when Supertrend A crosses below Supertrend B.
A fuchsia downward triangle ("S") is displayed on the chart above the price bar.
4. How to Use the Indicator:
Identifying Trend Changes:
When Supertrend A crosses above Supertrend B, it indicates a potential upward trend, generating a buy signal.
Conversely, when Supertrend A crosses below Supertrend B, it suggests a potential downward trend, generating a sell signal.
Signal Visualization:
Yellow "L" markers indicate long entry points (buy signals).
Fuchsia "S" markers indicate short entry points (sell signals).
Alerts:
The indicator is equipped with alert conditions for both long and short signals. Users can set up alerts in TradingView to receive notifications when these signals occur.
5. Customization:
Supertrend Parameters:
The factors and ATR periods for Supertrend A and B can be adjusted in the settings to fit different market conditions and trading strategies.
Show Signals Option:
The user can toggle the display of the buy and sell signals on the chart through the "Show Signals?" checkbox in the settings.
6. Visual Representation:
Lines:
Supertrend A: Plotted with dynamic coloring based on its relation to Supertrend B.
Supertrend B: Plotted in white for a clear reference.
Markers:
"L" (yellow) for long signals and "S" (fuchsia) for short signals are plotted on the chart at the point of crossover.
7. Alerts Setup:
Buy Signal Alert: Alerts the user when Supertrend A crosses above Supertrend B.
Sell Signal Alert: Alerts the user when Supertrend A crosses below Supertrend B.
8. Advantages:
Simple and Effective: This indicator simplifies trend identification by using crossovers of two Supertrend lines.
Customizable: The indicator's parameters can be tailored to suit different trading styles and asset classes.
Alerts: Provides alert functionality to ensure traders do not miss trading opportunities.
9. Usage Tips:
Combine with Other Indicators: For more reliable signals, consider using this indicator in conjunction with other technical analysis tools like RSI, MACD, or support and resistance levels.
Risk Management: Always use appropriate risk management techniques, such as stop-loss orders, to protect your capital.
The "Supertrend Crosses" indicator offers a straightforward approach to identifying potential trend reversals and trade entries using the crossover of two Supertrend lines. It provides clear visual signals and alert notifications, making it a valuable tool for traders looking to incorporate trend-following strategies.
오픈 소스 스크립트
트레이딩뷰의 진정한 정신에 따라, 이 스크립트의 작성자는 이를 오픈소스로 공개하여 트레이더들이 기능을 검토하고 검증할 수 있도록 했습니다. 작성자에게 찬사를 보냅니다! 이 코드는 무료로 사용할 수 있지만, 코드를 재게시하는 경우 하우스 룰이 적용된다는 점을 기억하세요.
면책사항
해당 정보와 게시물은 금융, 투자, 트레이딩 또는 기타 유형의 조언이나 권장 사항으로 간주되지 않으며, 트레이딩뷰에서 제공하거나 보증하는 것이 아닙니다. 자세한 내용은 이용 약관을 참조하세요.
오픈 소스 스크립트
트레이딩뷰의 진정한 정신에 따라, 이 스크립트의 작성자는 이를 오픈소스로 공개하여 트레이더들이 기능을 검토하고 검증할 수 있도록 했습니다. 작성자에게 찬사를 보냅니다! 이 코드는 무료로 사용할 수 있지만, 코드를 재게시하는 경우 하우스 룰이 적용된다는 점을 기억하세요.
면책사항
해당 정보와 게시물은 금융, 투자, 트레이딩 또는 기타 유형의 조언이나 권장 사항으로 간주되지 않으며, 트레이딩뷰에서 제공하거나 보증하는 것이 아닙니다. 자세한 내용은 이용 약관을 참조하세요.