OPEN-SOURCE SCRIPT
Weekly Bullish Pattern Detector
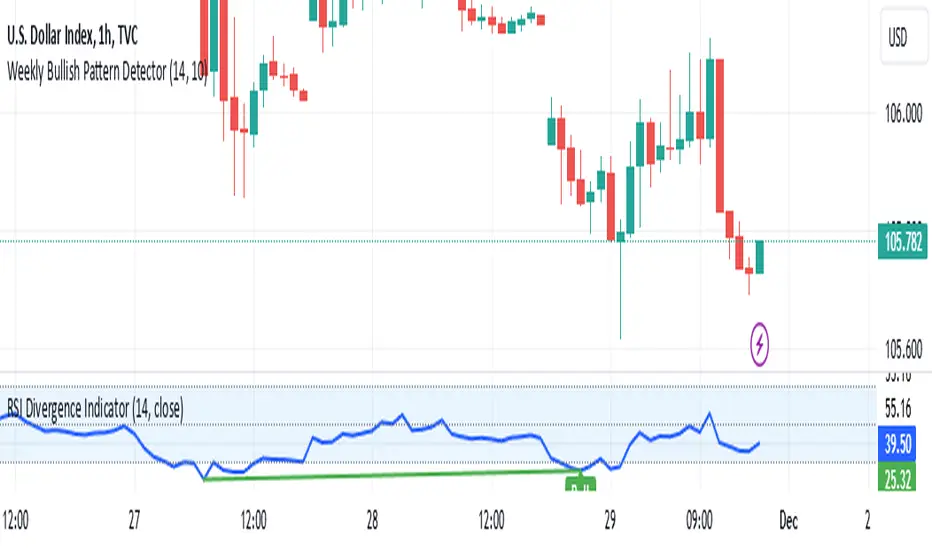
This script is a TradingView Pine Script designed to detect a specific bullish candlestick pattern on the weekly chart. Below is a detailed breakdown of its components:
1. Purpose
The script identifies a four-candle bullish pattern where:
The first candle is a long green (bullish) candlestick.
The second and third candles are small-bodied candles, signifying consolidation or indecision.
The fourth candle is another long green (bullish) candlestick.
When this pattern is detected, the script:
Marks the chart with a visual label.
Optionally triggers an alert to notify the trader.
2. Key Features
Overlay on Chart:
indicator("Weekly Bullish Pattern Detector", overlay=true) ensures the indicator draws directly on the price chart.
Customizable Inputs:
length (Body Size Threshold):
Defines the minimum percentage of the total range that qualifies as a "long" candle body (default: 14%).
smallCandleThreshold (Small Candle Body Threshold):
Defines the maximum percentage of the total range that qualifies as a "small" candle body (default: 10%).
Candlestick Property Calculations:
bodySize: Measures the absolute size of the candle body (close - open).
totalRange: Measures the total high-to-low range of the candle.
bodyPercentage: Calculates the proportion of the body size relative to the total range ((bodySize / totalRange) * 100).
isGreen and isRed: Identify bullish (green) or bearish (red) candles based on their open and close prices.
Pattern Conditions:
longGreenCandle:
Checks if the candle is bullish (isGreen) and its body percentage exceeds the defined length threshold.
smallCandle:
Identifies small-bodied candles where the body percentage is below the smallCandleThreshold.
consolidation:
Confirms the second and third candles are both small-bodied (smallCandle[1] and smallCandle[2]).
Bullish Pattern Detection:
bullishPattern:
Detects the full four-candle sequence:
The first candle (longGreenCandle[3]) is a long green candle.
The second and third candles (consolidation) are small-bodied.
The fourth candle (longGreenCandle) is another long green candle.
Visualization:
plotshape(bullishPattern):
Draws a green label ("Pattern") below the price chart whenever the pattern is detected.
Alert Notification:
alertcondition(bullishPattern):
Sends an alert with the message "Bullish Pattern Detected on Weekly Chart" whenever the pattern is found.
3. How It Works
Evaluates Candle Properties:
For each weekly candle, the script calculates its size, range, and body percentage.
Identifies Each Component of the Pattern:
Checks for a long green candle (first and fourth).
Verifies the presence of two small-bodied candles (second and third).
Detects and Marks the Pattern:
Confirms the sequence and marks the chart with a label if the pattern is complete.
Sends Alerts:
Notifies the trader when the pattern is detected.
4. Use Cases
This script is ideal for:
Swing Traders:
Spotting weekly patterns that indicate potential bullish continuations.
Breakout Traders:
Identifying consolidation zones followed by upward momentum.
Pattern Recognition:
Automatically detecting a commonly used bullish formation.
5. Key Considerations
Timeframe: Works best on weekly charts.
Customization: The thresholds for "long" and "small" candles can be adjusted to suit different markets or volatility levels.
Limitations:
It doesn't confirm the pattern's success; further analysis (e.g., volume, support/resistance levels) may be required for validation
오픈 소스 스크립트
트레이딩뷰의 진정한 정신에 따라, 이 스크립트의 작성자는 이를 오픈소스로 공개하여 트레이더들이 기능을 검토하고 검증할 수 있도록 했습니다. 작성자에게 찬사를 보냅니다! 이 코드는 무료로 사용할 수 있지만, 코드를 재게시하는 경우 하우스 룰이 적용된다는 점을 기억하세요.
면책사항
해당 정보와 게시물은 금융, 투자, 트레이딩 또는 기타 유형의 조언이나 권장 사항으로 간주되지 않으며, 트레이딩뷰에서 제공하거나 보증하는 것이 아닙니다. 자세한 내용은 이용 약관을 참조하세요.
오픈 소스 스크립트
트레이딩뷰의 진정한 정신에 따라, 이 스크립트의 작성자는 이를 오픈소스로 공개하여 트레이더들이 기능을 검토하고 검증할 수 있도록 했습니다. 작성자에게 찬사를 보냅니다! 이 코드는 무료로 사용할 수 있지만, 코드를 재게시하는 경우 하우스 룰이 적용된다는 점을 기억하세요.
면책사항
해당 정보와 게시물은 금융, 투자, 트레이딩 또는 기타 유형의 조언이나 권장 사항으로 간주되지 않으며, 트레이딩뷰에서 제공하거나 보증하는 것이 아닙니다. 자세한 내용은 이용 약관을 참조하세요.