OPEN-SOURCE SCRIPT
업데이트됨 KJS-- Gost Pivot MA
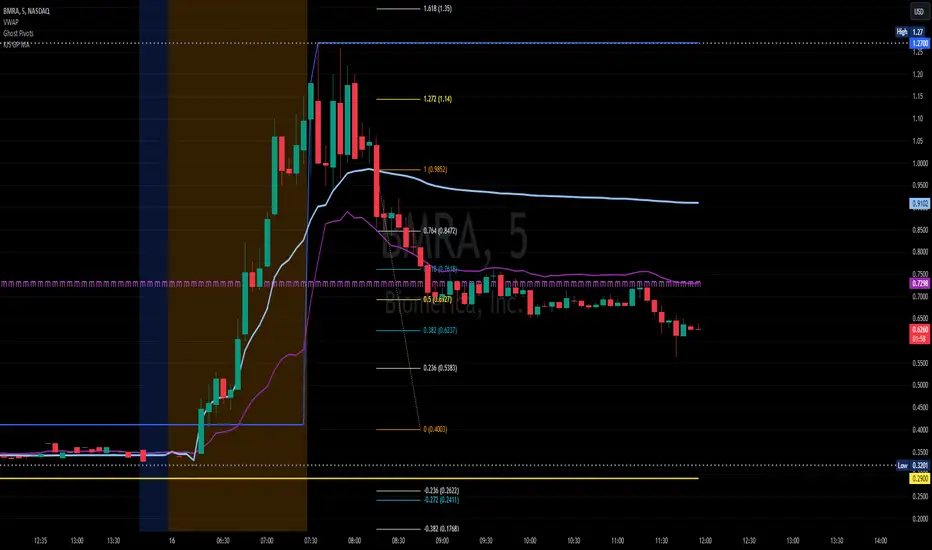
KJS Ghost Pivot Moving Average
This indicator calculates a "Ghost Pivot" by estimating where the monthly pivot level would be if the current candle's close represented the end of the month. The calculation uses:
• The current month's high and low from regular trading hours (RTH).
• The current candle's close, which includes both premarket and after-hours data.
It also smooths the ghost pivot using a customizable simple moving average (SMA).
Features:
• Plots the current month's high (blue) and low (yellow) based on RTH data.
• Calculates and plots a dynamic pivot (purple line) as the average of the monthly high, low, and current close (HLC3).
• Includes a customizable SMA length for smoother pivot tracking (default: 3).
This indicator helps traders anticipate potential monthly pivot levels in real-time while visualizing key support and resistance areas.
릴리즈 노트
KJS Ghost Pivot Moving AverageThis indicator calculates a “Ghost Pivot" by estimating where the monthly pivot level would be if the current candle’s close represented the end of the month. The calculation uses:
It also smooths the ghost pivot using a customizable simple moving average (SMA).
Features:
This indicator helps traders anticipate potential monthly pivot levels in real-time while visualizing key support and resistance areas.
릴리즈 노트
Update to Pine Script v6오픈 소스 스크립트
트레이딩뷰의 진정한 정신에 따라, 이 스크립트의 작성자는 이를 오픈소스로 공개하여 트레이더들이 기능을 검토하고 검증할 수 있도록 했습니다. 작성자에게 찬사를 보냅니다! 이 코드는 무료로 사용할 수 있지만, 코드를 재게시하는 경우 하우스 룰이 적용된다는 점을 기억하세요.
면책사항
해당 정보와 게시물은 금융, 투자, 트레이딩 또는 기타 유형의 조언이나 권장 사항으로 간주되지 않으며, 트레이딩뷰에서 제공하거나 보증하는 것이 아닙니다. 자세한 내용은 이용 약관을 참조하세요.
오픈 소스 스크립트
트레이딩뷰의 진정한 정신에 따라, 이 스크립트의 작성자는 이를 오픈소스로 공개하여 트레이더들이 기능을 검토하고 검증할 수 있도록 했습니다. 작성자에게 찬사를 보냅니다! 이 코드는 무료로 사용할 수 있지만, 코드를 재게시하는 경우 하우스 룰이 적용된다는 점을 기억하세요.
면책사항
해당 정보와 게시물은 금융, 투자, 트레이딩 또는 기타 유형의 조언이나 권장 사항으로 간주되지 않으며, 트레이딩뷰에서 제공하거나 보증하는 것이 아닙니다. 자세한 내용은 이용 약관을 참조하세요.