PROTECTED SOURCE SCRIPT
Phoenix EMA System
Phoenix EMA System 🐦🔥
rising after the retest like a phoenix reborn
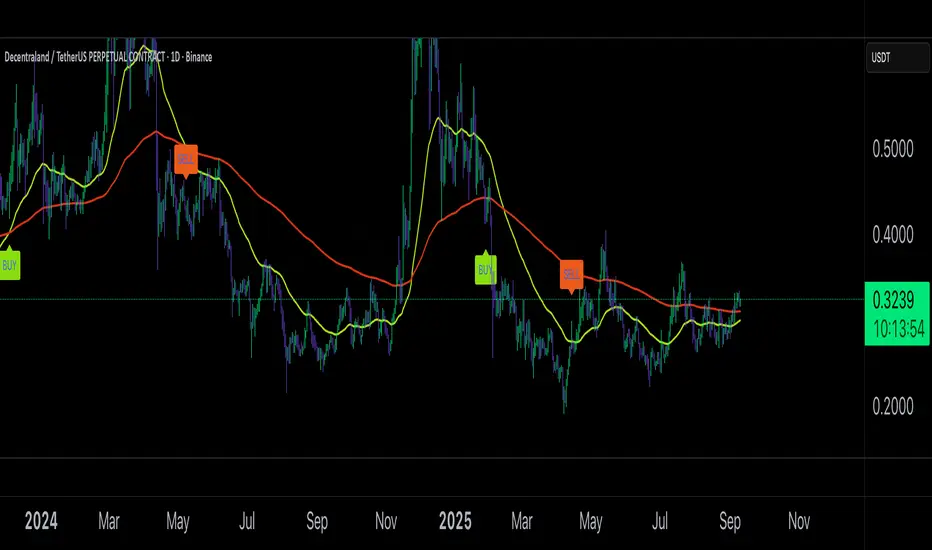
The Golden Retest System is a trend-following indicator based on the classic 50 EMA / 200 EMA crossover. Unlike the standard “Golden Cross” or “Death Cross,” this tool waits for price to retest the key EMA after a crossover before giving a signal. This reduces false breakouts and provides cleaner entries.
Buy Signal: Triggered when the 50 EMA crosses above the 200 EMA, followed by a retest of the 200 EMA.
Sell Signal: Triggered when the 50 EMA crosses below the 200 EMA, followed by a retest of the 50 EMA.
📖 Instructions
Add the indicator to your chart.
Watch for BUY and SELL labels plotted when conditions are met.
For Buy setups:
Wait for the 50 EMA to cross above the 200 EMA.
Enter long on the retest of the 200 EMA (signaled by the indicator).
For Sell setups:
Wait for the 50 EMA to cross below the 200 EMA.
Enter short on the retest of the 50 EMA (signaled by the indicator).
Use additional filters such as volume, higher timeframe trend, or risk management rules for confirmation.
⏳ Recommended Timeframes
Best performance on 4H, 12H, and Daily charts.
Works for swing and position traders.
Lower timeframes (15m, 1H) can be used but may produce more noise. Confirm with higher timeframe bias.
⚠️ Disclaimer
This indicator is for educational purposes only. It is not financial advice. Always test thoroughly and apply proper risk management before using it in live trading.
rising after the retest like a phoenix reborn
The Golden Retest System is a trend-following indicator based on the classic 50 EMA / 200 EMA crossover. Unlike the standard “Golden Cross” or “Death Cross,” this tool waits for price to retest the key EMA after a crossover before giving a signal. This reduces false breakouts and provides cleaner entries.
Buy Signal: Triggered when the 50 EMA crosses above the 200 EMA, followed by a retest of the 200 EMA.
Sell Signal: Triggered when the 50 EMA crosses below the 200 EMA, followed by a retest of the 50 EMA.
📖 Instructions
Add the indicator to your chart.
Watch for BUY and SELL labels plotted when conditions are met.
For Buy setups:
Wait for the 50 EMA to cross above the 200 EMA.
Enter long on the retest of the 200 EMA (signaled by the indicator).
For Sell setups:
Wait for the 50 EMA to cross below the 200 EMA.
Enter short on the retest of the 50 EMA (signaled by the indicator).
Use additional filters such as volume, higher timeframe trend, or risk management rules for confirmation.
⏳ Recommended Timeframes
Best performance on 4H, 12H, and Daily charts.
Works for swing and position traders.
Lower timeframes (15m, 1H) can be used but may produce more noise. Confirm with higher timeframe bias.
⚠️ Disclaimer
This indicator is for educational purposes only. It is not financial advice. Always test thoroughly and apply proper risk management before using it in live trading.
보호된 스크립트입니다
이 스크립트는 비공개 소스로 게시됩니다. 하지만 제한 없이 자유롭게 사용할 수 있습니다 — 여기에서 자세히 알아보기.
면책사항
이 정보와 게시물은 TradingView에서 제공하거나 보증하는 금융, 투자, 거래 또는 기타 유형의 조언이나 권고 사항을 의미하거나 구성하지 않습니다. 자세한 내용은 이용 약관을 참고하세요.
보호된 스크립트입니다
이 스크립트는 비공개 소스로 게시됩니다. 하지만 제한 없이 자유롭게 사용할 수 있습니다 — 여기에서 자세히 알아보기.
면책사항
이 정보와 게시물은 TradingView에서 제공하거나 보증하는 금융, 투자, 거래 또는 기타 유형의 조언이나 권고 사항을 의미하거나 구성하지 않습니다. 자세한 내용은 이용 약관을 참고하세요.