OPEN-SOURCE SCRIPT
90-Day Beta to BTC
Overview:
The 90-Day Beta to BTC indicator measures the volatility of a specific token relative to Bitcoin (BTC) over the past 90 days. Beta is a widely used statistical measure in financial markets that indicates how much a token's price moves in relation to BTC. A higher beta means the token is more volatile compared to BTC, while a lower beta means it is less volatile or moves similarly to BTC.
How It Works:
This indicator calculates the daily logarithmic returns of both the token and Bitcoin, then computes the covariance between their returns and the variance of Bitcoin’s returns. The resulting Beta value reflects the degree to which the token’s price fluctuates relative to Bitcoin's price over the past 90 days.
Beta > 1: The token is more volatile than Bitcoin, showing higher price swings.
Beta = 1: The token moves in lockstep with Bitcoin, exhibiting similar volatility.
Beta < 1: The token is less volatile than Bitcoin, showing smaller price fluctuations.
Beta = 0: The token's price movement is uncorrelated with Bitcoin’s price.
Negative Beta: The token moves opposite to Bitcoin, indicating an inverse relationship.
Use Case:
This indicator is particularly useful for traders or investors looking to identify tokens with high speculative volatility. Tokens with Beta values above 1 are typically high-risk, high-reward assets, often driven by hype, social trends, or market speculation. Conversely, tokens with Beta values below 1 offer a more stable price relationship with Bitcoin, making them less volatile and potentially safer.
In the context of a Trash Token Tournament, tokens with a higher Beta (greater than 1) may be more attractive due to their heightened volatility and potential for larger price swings, making them the “wild cards” of the market.
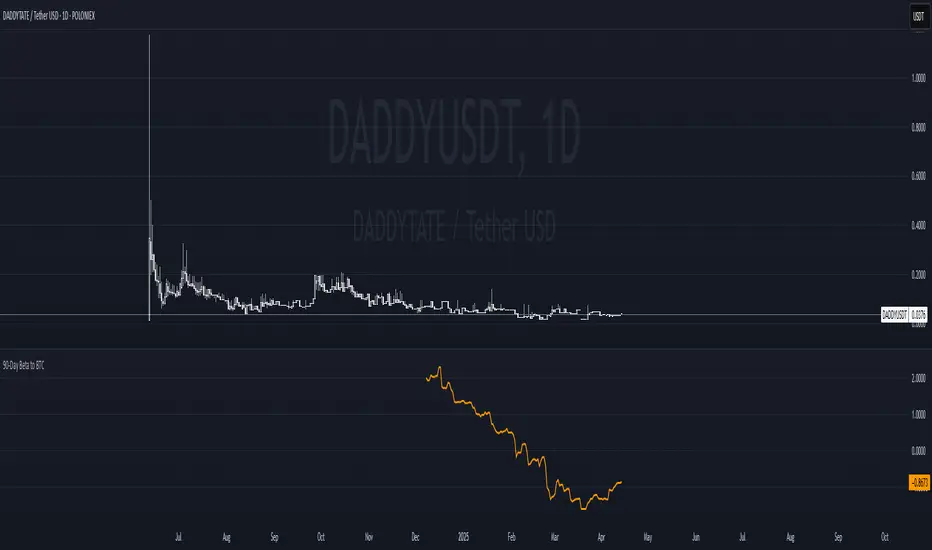
Visual Representation:
The Beta value is plotted as a line chart beneath the main price chart, offering a visual representation of the token’s volatility relative to Bitcoin over the last 90 days. Spikes in Beta indicate periods of increased volatility, while drops suggest stability.
The 90-Day Beta to BTC indicator measures the volatility of a specific token relative to Bitcoin (BTC) over the past 90 days. Beta is a widely used statistical measure in financial markets that indicates how much a token's price moves in relation to BTC. A higher beta means the token is more volatile compared to BTC, while a lower beta means it is less volatile or moves similarly to BTC.
How It Works:
This indicator calculates the daily logarithmic returns of both the token and Bitcoin, then computes the covariance between their returns and the variance of Bitcoin’s returns. The resulting Beta value reflects the degree to which the token’s price fluctuates relative to Bitcoin's price over the past 90 days.
Beta > 1: The token is more volatile than Bitcoin, showing higher price swings.
Beta = 1: The token moves in lockstep with Bitcoin, exhibiting similar volatility.
Beta < 1: The token is less volatile than Bitcoin, showing smaller price fluctuations.
Beta = 0: The token's price movement is uncorrelated with Bitcoin’s price.
Negative Beta: The token moves opposite to Bitcoin, indicating an inverse relationship.
Use Case:
This indicator is particularly useful for traders or investors looking to identify tokens with high speculative volatility. Tokens with Beta values above 1 are typically high-risk, high-reward assets, often driven by hype, social trends, or market speculation. Conversely, tokens with Beta values below 1 offer a more stable price relationship with Bitcoin, making them less volatile and potentially safer.
In the context of a Trash Token Tournament, tokens with a higher Beta (greater than 1) may be more attractive due to their heightened volatility and potential for larger price swings, making them the “wild cards” of the market.
Visual Representation:
The Beta value is plotted as a line chart beneath the main price chart, offering a visual representation of the token’s volatility relative to Bitcoin over the last 90 days. Spikes in Beta indicate periods of increased volatility, while drops suggest stability.
오픈 소스 스크립트
트레이딩뷰의 진정한 정신에 따라, 이 스크립트의 작성자는 이를 오픈소스로 공개하여 트레이더들이 기능을 검토하고 검증할 수 있도록 했습니다. 작성자에게 찬사를 보냅니다! 이 코드는 무료로 사용할 수 있지만, 코드를 재게시하는 경우 하우스 룰이 적용된다는 점을 기억하세요.
면책사항
해당 정보와 게시물은 금융, 투자, 트레이딩 또는 기타 유형의 조언이나 권장 사항으로 간주되지 않으며, 트레이딩뷰에서 제공하거나 보증하는 것이 아닙니다. 자세한 내용은 이용 약관을 참조하세요.
오픈 소스 스크립트
트레이딩뷰의 진정한 정신에 따라, 이 스크립트의 작성자는 이를 오픈소스로 공개하여 트레이더들이 기능을 검토하고 검증할 수 있도록 했습니다. 작성자에게 찬사를 보냅니다! 이 코드는 무료로 사용할 수 있지만, 코드를 재게시하는 경우 하우스 룰이 적용된다는 점을 기억하세요.
면책사항
해당 정보와 게시물은 금융, 투자, 트레이딩 또는 기타 유형의 조언이나 권장 사항으로 간주되지 않으며, 트레이딩뷰에서 제공하거나 보증하는 것이 아닙니다. 자세한 내용은 이용 약관을 참조하세요.