OPEN-SOURCE SCRIPT
업데이트됨 Max/Min Levels
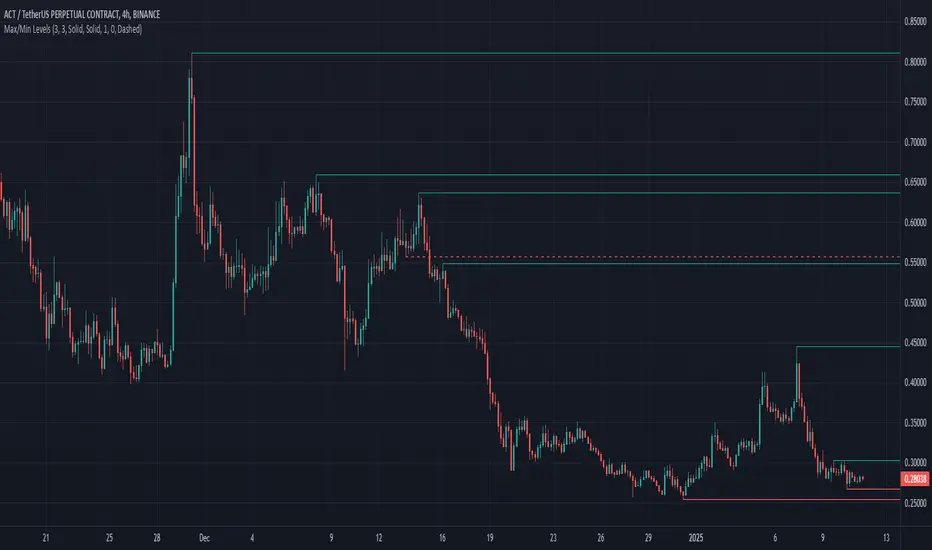
Highlights highs and lows that match the search criteria. A high is considered to be broken if the candlestick breaks through its shadow
A three-candlestick pattern will match the parameters:
A five-candlestick pattern will match the parameters:
A three-candlestick pattern will match the parameters:
- Candle before - 1
- Candle after - 1
A five-candlestick pattern will match the parameters:
- Candle before - 2
- Candle after - 2
릴리즈 노트
Highlights highs and lows that match the search criteria. A high is considered to be broken if the candlestick breaks through its shadowA three-candlestick pattern will match the parameters:
- Candle before - 1
- Candle after - 1
A five-candlestick pattern will match the parameters:
- Candle before - 2
- Candle after - 2
릴리즈 노트
Fixed the issue of false lines appearing at the beginning of the chart릴리즈 노트
Added the option to delete the line immediately after it is crossed or after the candle formation is complete릴리즈 노트
In history, the line continues until it touches a candlestick.Also, the number of lines that can be displayed on the chart has been increased to 150.
릴리즈 노트
Shows the highs and lows that were broken by a single candle릴리즈 노트
Added the ability to set the number of lines to be displayed on the chart릴리즈 노트
Added the ability to enable level breakdown notificationsFirst, mark which notifications you want to receive, about a level breakout or a breakout of resistance and support levels (dashed line on the chart).
Create a new alert and in the "Condition" column select the indicator name. In the column below select "Any alert() function call" if it is not selected and click the "Create" button. That's it, you're done
릴리즈 노트
Added the ability to use the indicator in Pine Screener. Allows you to conveniently search for coins that have a broken level or a pricked level, and also how many percent to the nearest level- New Tab -> Screeners -> Pine (Beta)
https://i.postimg.cc/T1WqyWv4/Max-Min-Screener-1.jpg
- A list with coin pairs
- A timeframe for analysis
- Indicator settings
- Setup the indicator according to your requirements
- Check the box next to "Candle number" to make the indicator work in "Pine Screener" mode
- 0 - analysis of the current candle, 1 - analysis of the second candle on the chart, 2,3... etc.
- Confirm settings
- Click "Scan"
After that, you will see a window with the data
https://i.postimg.cc/wMcJYCCc/Max-Min-Screener-2.jpg
- To Up, To Down, To Broken Up, To Broken Down - Shows how many percent to the nearest level. If the value is negative, it means that the price broke the level
- Pricked Up, Pricked Down, Pricked Broken Up, Pricked Broken Down - "1" means that the price pierced the level with its shadow
Good luck with your search everyone!
오픈 소스 스크립트
트레이딩뷰의 진정한 정신에 따라, 이 스크립트의 작성자는 이를 오픈소스로 공개하여 트레이더들이 기능을 검토하고 검증할 수 있도록 했습니다. 작성자에게 찬사를 보냅니다! 이 코드는 무료로 사용할 수 있지만, 코드를 재게시하는 경우 하우스 룰이 적용된다는 점을 기억하세요.
면책사항
해당 정보와 게시물은 금융, 투자, 트레이딩 또는 기타 유형의 조언이나 권장 사항으로 간주되지 않으며, 트레이딩뷰에서 제공하거나 보증하는 것이 아닙니다. 자세한 내용은 이용 약관을 참조하세요.
오픈 소스 스크립트
트레이딩뷰의 진정한 정신에 따라, 이 스크립트의 작성자는 이를 오픈소스로 공개하여 트레이더들이 기능을 검토하고 검증할 수 있도록 했습니다. 작성자에게 찬사를 보냅니다! 이 코드는 무료로 사용할 수 있지만, 코드를 재게시하는 경우 하우스 룰이 적용된다는 점을 기억하세요.
면책사항
해당 정보와 게시물은 금융, 투자, 트레이딩 또는 기타 유형의 조언이나 권장 사항으로 간주되지 않으며, 트레이딩뷰에서 제공하거나 보증하는 것이 아닙니다. 자세한 내용은 이용 약관을 참조하세요.