OPEN-SOURCE SCRIPT
업데이트됨 FLEX KDJ IND
Hi Dears!
Here you have this ability to define different methods to aquire high and low bonds in KDJ indicator.
Thses Topologies are available in Popup menu and could be defined by user:
- "AVG" : Use average of cashed data in both High and low Bond
- "MEDIAN" : Use median of cashed data in both High and low Bond
- "MAX" : Use Max of cashed data in both High and low Bond
- "MIN" : Use Min of cashed data in both High and low Bond
- "WIDE" : Use Max of cashed data in High and Min of them for low Bond
- "NARROW" : Use Min of cashed data in High and Max of them for low Bond
- "FIX" : Use predefined constant values by user in 'Max BOND' and 'Min BOND'
- "GAUSS" Use statistical standard deviation method and 'Mult. Max BOND' and 'Mult. Min BOND' to calculate High and low Bond.
In "LEFT RANGE" and "RIGHT RANGE" you can define the range which be used to find pivot and extremum points in calculation of highest and lowest LONG-TERM KDJ Line.
'MEMORY' is the size of cash that you want to collect the extracted data from extreimum points for highest and lowest LONG-TERM-KDJ. If overflowing from this point the oldest value would be kicked from cash.
Other parts are same in KDJ Indicators.
Enjoy trading!
Shakib.
릴리즈 노트
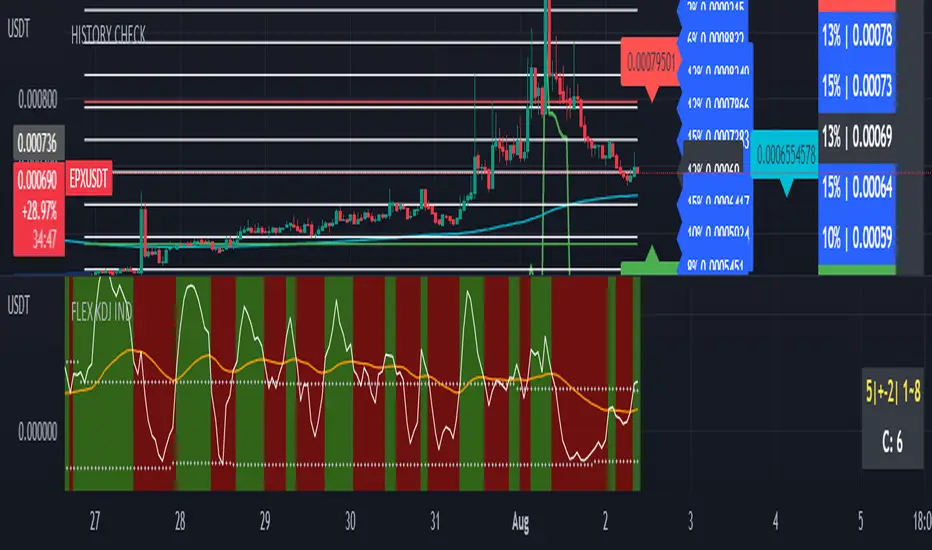
There were two variables that has to be reversed.Add to this now user has a number to guess till when red area would be continued.
Firts number in yellow is the Average, second one is the Std and thirs one is the range.
White value is the current (or the last) counter in red area.
ENJOY!
릴리즈 노트
Two smoothing length are now separated to be similar to what we have in KDJ IND in binance.릴리즈 노트
I just check it and found that the picture of indicator is not relevant to the indicator! The version is still same as before just pictured in published script is changed.happy trade
릴리즈 노트
Hi Dears!in new Version you have two more options for your boundaries definitions:
- [LOWER BOND, UPPER BOND]
오픈 소스 스크립트
트레이딩뷰의 진정한 정신에 따라, 이 스크립트의 작성자는 이를 오픈소스로 공개하여 트레이더들이 기능을 검토하고 검증할 수 있도록 했습니다. 작성자에게 찬사를 보냅니다! 이 코드는 무료로 사용할 수 있지만, 코드를 재게시하는 경우 하우스 룰이 적용된다는 점을 기억하세요.
면책사항
해당 정보와 게시물은 금융, 투자, 트레이딩 또는 기타 유형의 조언이나 권장 사항으로 간주되지 않으며, 트레이딩뷰에서 제공하거나 보증하는 것이 아닙니다. 자세한 내용은 이용 약관을 참조하세요.
오픈 소스 스크립트
트레이딩뷰의 진정한 정신에 따라, 이 스크립트의 작성자는 이를 오픈소스로 공개하여 트레이더들이 기능을 검토하고 검증할 수 있도록 했습니다. 작성자에게 찬사를 보냅니다! 이 코드는 무료로 사용할 수 있지만, 코드를 재게시하는 경우 하우스 룰이 적용된다는 점을 기억하세요.
면책사항
해당 정보와 게시물은 금융, 투자, 트레이딩 또는 기타 유형의 조언이나 권장 사항으로 간주되지 않으며, 트레이딩뷰에서 제공하거나 보증하는 것이 아닙니다. 자세한 내용은 이용 약관을 참조하세요.