OPEN-SOURCE SCRIPT
5-8-13 + AVWAP + Fibonacci FULL Sistem (Temiz & Profesyonel)
✅ What This Indicator Is Doing (Full Explanation in English)
Your custom system combines several powerful components:
EMA 5-8-13,
AVWAP,
Auto Fibonacci,
Triple-Confirmation Buy/Sell Signals,
Background Trend Coloring.
Below is the complete breakdown.
🟩 1. Trend Detection with EMA 5-8-13
The indicator colors the background based on the alignment of:
EMA 5
EMA 8
EMA 13
Trend logic:
Uptrend (Green background):
EMA5 > EMA8 > EMA13
Downtrend (Red background):
EMA5 < EMA8 < EMA13
Caution Zone (Brown/Orange):
EMA5 < EMA8 but EMA8 > EMA13
→ Trend weakening, prepare for reversal.
🟩 2. Classic Buy/Sell Signals (EMA Cross)
These labels are the small “AL” and “SAT” signals.
BUY: EMA 5 crosses above EMA 13
SELL: EMA 5 crosses below EMA 13
This captures basic trend reversals.
🟩 3. AVWAP Dip/Peak Detection
The indicator automatically finds significant swing points:
AVWAP DIP (Green small label)
AVWAP PEAK (Red small label)
It then launches a new AVWAP line starting from that pivot.
So the yellow line is always the current Anchored VWAP starting from the most recent important DIP or PEAK.
🟩 4. Auto Fibonacci Levels (Clean Version)
The indicator calculates Fibonacci levels based on the last N bars (120 by default):
0.0
0.236
0.382
0.500
0.618
0.786
1.0
You now use the clean version, meaning:
✔ Only one set of Fibonacci lines appears
✔ No overlapping lines
✔ No chart clutter
✔ Always readable and minimal
🟩 5. Triple-Confirmation Buy/Sell Signals (Strong Signals)
These are the more important green/red labels (“🔥 AL” / “⚠️ SAT”).
A TRIPLE BUY (AL) happens when:
Price breaks above AVWAP
EMA 5-8-13 are aligned upward (trendUp)
Price is above Fibonacci 0.382
A TRIPLE SELL (SAT) happens when:
Price breaks below AVWAP
EMA 5-8-13 aligned downward (trendDown)
Price is below Fibonacci 0.382
This removes weak signals and gives high-quality entries and exits.
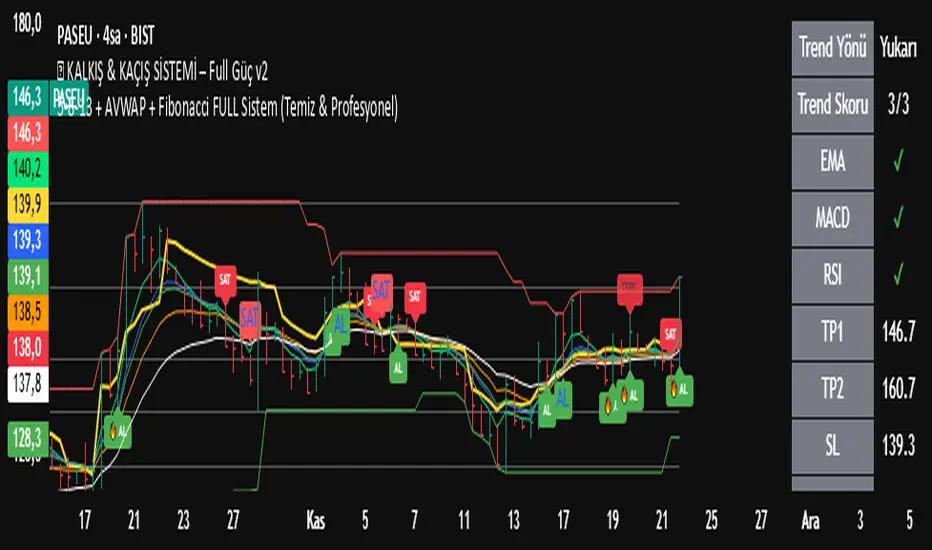
🟩 Summary of What You Saw on the Chart
Trend shifted to caution zone
Then EMA trend fully turned bearish
Price broke below AVWAP
Price dropped below Fibonacci 0.382
Triple Confirmation Sell appeared
Downtrend continued strongly afterward
Your indicator correctly identified:
👉 Trend weakening
👉 Bearish reversal
👉 Strong Sell zone
👉 Final drop
Your custom system combines several powerful components:
EMA 5-8-13,
AVWAP,
Auto Fibonacci,
Triple-Confirmation Buy/Sell Signals,
Background Trend Coloring.
Below is the complete breakdown.
🟩 1. Trend Detection with EMA 5-8-13
The indicator colors the background based on the alignment of:
EMA 5
EMA 8
EMA 13
Trend logic:
Uptrend (Green background):
EMA5 > EMA8 > EMA13
Downtrend (Red background):
EMA5 < EMA8 < EMA13
Caution Zone (Brown/Orange):
EMA5 < EMA8 but EMA8 > EMA13
→ Trend weakening, prepare for reversal.
🟩 2. Classic Buy/Sell Signals (EMA Cross)
These labels are the small “AL” and “SAT” signals.
BUY: EMA 5 crosses above EMA 13
SELL: EMA 5 crosses below EMA 13
This captures basic trend reversals.
🟩 3. AVWAP Dip/Peak Detection
The indicator automatically finds significant swing points:
AVWAP DIP (Green small label)
AVWAP PEAK (Red small label)
It then launches a new AVWAP line starting from that pivot.
So the yellow line is always the current Anchored VWAP starting from the most recent important DIP or PEAK.
🟩 4. Auto Fibonacci Levels (Clean Version)
The indicator calculates Fibonacci levels based on the last N bars (120 by default):
0.0
0.236
0.382
0.500
0.618
0.786
1.0
You now use the clean version, meaning:
✔ Only one set of Fibonacci lines appears
✔ No overlapping lines
✔ No chart clutter
✔ Always readable and minimal
🟩 5. Triple-Confirmation Buy/Sell Signals (Strong Signals)
These are the more important green/red labels (“🔥 AL” / “⚠️ SAT”).
A TRIPLE BUY (AL) happens when:
Price breaks above AVWAP
EMA 5-8-13 are aligned upward (trendUp)
Price is above Fibonacci 0.382
A TRIPLE SELL (SAT) happens when:
Price breaks below AVWAP
EMA 5-8-13 aligned downward (trendDown)
Price is below Fibonacci 0.382
This removes weak signals and gives high-quality entries and exits.
🟩 Summary of What You Saw on the Chart
Trend shifted to caution zone
Then EMA trend fully turned bearish
Price broke below AVWAP
Price dropped below Fibonacci 0.382
Triple Confirmation Sell appeared
Downtrend continued strongly afterward
Your indicator correctly identified:
👉 Trend weakening
👉 Bearish reversal
👉 Strong Sell zone
👉 Final drop
오픈 소스 스크립트
트레이딩뷰의 진정한 정신에 따라, 이 스크립트의 작성자는 이를 오픈소스로 공개하여 트레이더들이 기능을 검토하고 검증할 수 있도록 했습니다. 작성자에게 찬사를 보냅니다! 이 코드는 무료로 사용할 수 있지만, 코드를 재게시하는 경우 하우스 룰이 적용된다는 점을 기억하세요.
Telegram kanalımızdakı sinyaller ücretsizdir.
면책사항
해당 정보와 게시물은 금융, 투자, 트레이딩 또는 기타 유형의 조언이나 권장 사항으로 간주되지 않으며, 트레이딩뷰에서 제공하거나 보증하는 것이 아닙니다. 자세한 내용은 이용 약관을 참조하세요.