OPEN-SOURCE SCRIPT
High/Low Weekly Timeframe
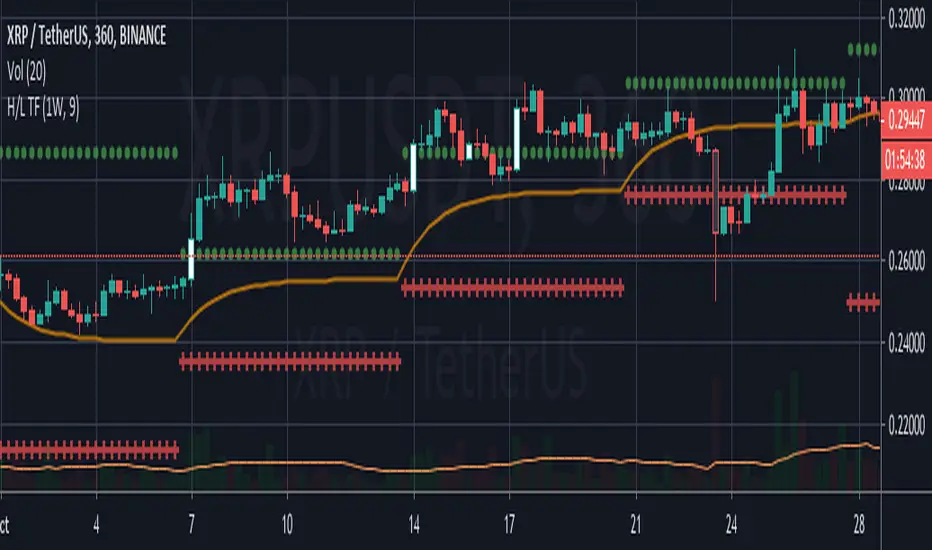
I'm testing a simple but useful indicator that plots the high and low for the current week. The time-frame can be selected by the user.
It's useful when you're trading in a smaller time-frame (example: 1H or 4H) to know exactly the weekly low and high, and whether the price breaks above or below this price lines.
This indicator allows you:
- To select the desired time-frame to get the Low and High.
- To print an optional EMA for the same time-frame.
- To optionally change the bar-color when the close price crosses above the weekly high or crosses below the weekly low.
Hope this helps you to visually identify price movements.
If you like this script please give me a like and comment below.
Thanks,
Rodrigo
오픈 소스 스크립트
트레이딩뷰의 진정한 정신에 따라, 이 스크립트의 작성자는 이를 오픈소스로 공개하여 트레이더들이 기능을 검토하고 검증할 수 있도록 했습니다. 작성자에게 찬사를 보냅니다! 이 코드는 무료로 사용할 수 있지만, 코드를 재게시하는 경우 하우스 룰이 적용된다는 점을 기억하세요.
면책사항
해당 정보와 게시물은 금융, 투자, 트레이딩 또는 기타 유형의 조언이나 권장 사항으로 간주되지 않으며, 트레이딩뷰에서 제공하거나 보증하는 것이 아닙니다. 자세한 내용은 이용 약관을 참조하세요.
오픈 소스 스크립트
트레이딩뷰의 진정한 정신에 따라, 이 스크립트의 작성자는 이를 오픈소스로 공개하여 트레이더들이 기능을 검토하고 검증할 수 있도록 했습니다. 작성자에게 찬사를 보냅니다! 이 코드는 무료로 사용할 수 있지만, 코드를 재게시하는 경우 하우스 룰이 적용된다는 점을 기억하세요.
면책사항
해당 정보와 게시물은 금융, 투자, 트레이딩 또는 기타 유형의 조언이나 권장 사항으로 간주되지 않으며, 트레이딩뷰에서 제공하거나 보증하는 것이 아닙니다. 자세한 내용은 이용 약관을 참조하세요.