OPEN-SOURCE SCRIPT
업데이트됨 Beta Tracker [theUltimator5]
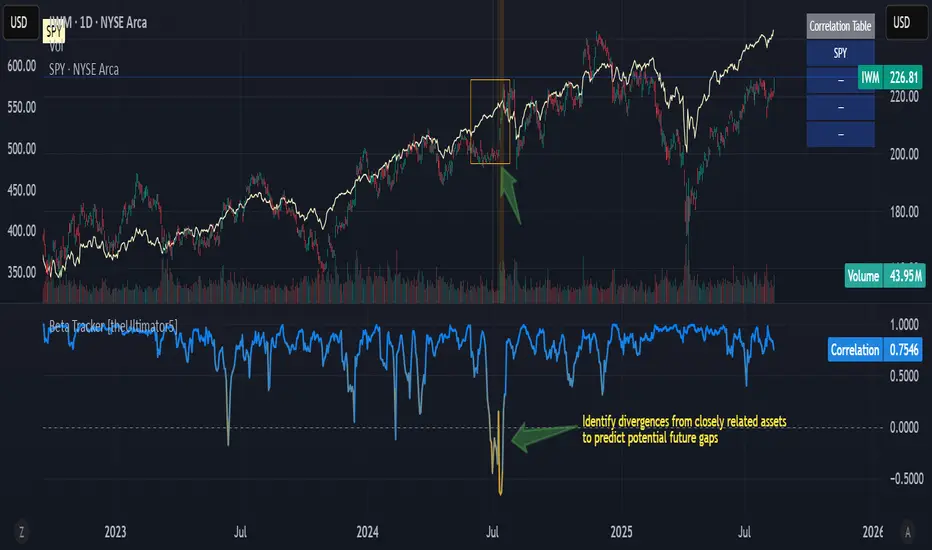
This script calculates the Pearson correlation coefficient between the charted symbol and a dynamic composite of up to four other user-defined tickers. The goal is to track how closely the current asset’s normalized price behavior aligns with, or diverges from, the selected group (or basket)
How can this indicator be valuable?
🛠️ How It Works
Blue = strongly correlated (near +1)
Orange = strongly inverse correlation (near –1)
Intermediate values fade proportionally
A highlighted background appears when the correlation drops below a user-defined threshold (e.g. –0.7), helping identify strong negative beta periods visually.
A toggleable info table displays which tickers are currently being compared, along with customizable screen positioning.
⚙️ User Inputs
https://imgur.com/a/bBQ1LUN
⚠️ Notes
How can this indicator be valuable?
- You can compare the correlation of your current symbol against a basket of other tickers to see if it is moving independently, or being pulled with the basket.... or is it moving against the basket.
- It can be used to help identify 'swap' baskets of stocks or other tickers that tend to generally move together and visually show when your current ticker diverges from the basket.
- It can be used to track beta (or negative beta) with the market or with a specific ticker.
- This is best used as a supplement to other trading signals to give a more complete picture of the external forces potentially pulling or pushing the price action of the ticker.
🛠️ How It Works
- The current symbol and each selected comparison ticker are normalized over a custom lookback window, allowing fair pattern-based comparison regardless of price scale.
- The normalized values from 1 to 4 selected tickers are averaged into a composite, which represents the group’s collective movement.
- A Pearson correlation coefficient is computed over a separate correlation lookback period, measuring the relationship between the current asset and the composite.
- The result is plotted as a dynamic line, with color gradients:
Blue = strongly correlated (near +1)
Orange = strongly inverse correlation (near –1)
Intermediate values fade proportionally
A highlighted background appears when the correlation drops below a user-defined threshold (e.g. –0.7), helping identify strong negative beta periods visually.
A toggleable info table displays which tickers are currently being compared, along with customizable screen positioning.
⚙️ User Inputs
- Ticker 1–4: Symbols to compare the current asset against (blank = ignored)
- Normalization Lookback: Period to normalize each series
- Correlation Lookback: Period over which correlation is calculated
- Negative Correlation Highlight: Toggle for background alert and threshold level
- Comparison Table: Toggle and position controls for an on-screen summary of selected tickers
https://imgur.com/a/bBQ1LUN
⚠️ Notes
- The script uses request.security() to pull data from external symbols; these must be available for the selected chart timeframe.
- A minimum of one valid ticker must be provided for the script to calculate a composite and render correlation.
릴리즈 노트
Updated chart to show indicator name in order to abide by house publishing rulesAdded labels to chart to highlight use case
오픈 소스 스크립트
트레이딩뷰의 진정한 정신에 따라, 이 스크립트의 작성자는 이를 오픈소스로 공개하여 트레이더들이 기능을 검토하고 검증할 수 있도록 했습니다. 작성자에게 찬사를 보냅니다! 이 코드는 무료로 사용할 수 있지만, 코드를 재게시하는 경우 하우스 룰이 적용된다는 점을 기억하세요.
면책사항
해당 정보와 게시물은 금융, 투자, 트레이딩 또는 기타 유형의 조언이나 권장 사항으로 간주되지 않으며, 트레이딩뷰에서 제공하거나 보증하는 것이 아닙니다. 자세한 내용은 이용 약관을 참조하세요.
오픈 소스 스크립트
트레이딩뷰의 진정한 정신에 따라, 이 스크립트의 작성자는 이를 오픈소스로 공개하여 트레이더들이 기능을 검토하고 검증할 수 있도록 했습니다. 작성자에게 찬사를 보냅니다! 이 코드는 무료로 사용할 수 있지만, 코드를 재게시하는 경우 하우스 룰이 적용된다는 점을 기억하세요.
면책사항
해당 정보와 게시물은 금융, 투자, 트레이딩 또는 기타 유형의 조언이나 권장 사항으로 간주되지 않으며, 트레이딩뷰에서 제공하거나 보증하는 것이 아닙니다. 자세한 내용은 이용 약관을 참조하세요.