OPEN-SOURCE SCRIPT
업데이트됨 VVIX/VIX Ratio with Interpretation Levels
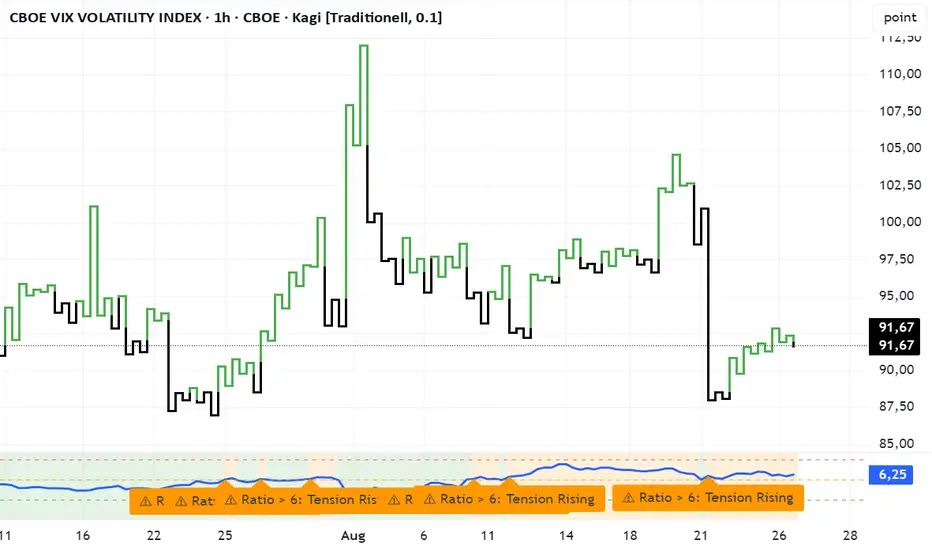
VVIX/VIX Ratio with Interpretation Levels
This indicator plots the ratio of VVIX (Volatility of Volatility Index) to VIX (CBOE Volatility Index) in a separate panel.
The ratio highlights when the options market is pricing unusually high volatility in volatility (VVIX) relative to the base volatility index (VIX).
Ratio < 5 → Complacency: Markets expect stability; often a pre-shock zone.
5–6 → Tension Building: Traders begin hedging volatility risk while VIX remains low.
6–7 → Elevated Risk: Divergence warns of potential regime change in volatility.
> 7 → High-Risk Zone: Options market pricing aggressive swings; can precede volatility spikes in equities.
The script also includes dashed interpretation lines (5, 6, 7) and automatic labels when key thresholds are crossed.
Background shading helps visualize current regime.
Use cases:
Detect hidden stress when VIX remains calm but VVIX rises.
Anticipate potential volatility regime shifts.
Support risk management and timing of long/short volatility strategies.
릴리즈 노트
DescriptionThe VVIX/VIX Ratio Indicator plots the ratio of the CBOE VVIX (Volatility of Volatility Index) to the CBOE VIX (Volatility Index) in a separate panel.
This ratio is a useful signal to detect when the options market is pricing volatility-of-volatility significantly higher relative to equity volatility.
Interpretation Levels
Ratio < 5 → Complacency – Market calm, often precedes shocks
5–6 → Tension Building – Options traders begin hedging, VIX still calm
6–7 → Elevated Risk – Divergence may indicate regime shift
> 7 → High-Risk Zone – Panic or crisis pricing, potential volatility spike
Features:
Colored background zones (complacency → high risk)
Horizontal threshold lines at 5, 6, 7
Automatic labels when levels are crossed
Clean ratio visualization with customizable levels
Use Cases:
Early warning system for hidden stress when VIX remains low
Risk management for volatility strategies
Identifying regime changes in volatility pricing
License
Open Source – MIT License (2025).
Free to use, share, and modify with attribution.
Disclaimer: This script is for educational purposes only and does not constitute financial advice. Use at your own risk.
오픈 소스 스크립트
트레이딩뷰의 진정한 정신에 따라, 이 스크립트의 작성자는 이를 오픈소스로 공개하여 트레이더들이 기능을 검토하고 검증할 수 있도록 했습니다. 작성자에게 찬사를 보냅니다! 이 코드는 무료로 사용할 수 있지만, 코드를 재게시하는 경우 하우스 룰이 적용된다는 점을 기억하세요.
면책사항
해당 정보와 게시물은 금융, 투자, 트레이딩 또는 기타 유형의 조언이나 권장 사항으로 간주되지 않으며, 트레이딩뷰에서 제공하거나 보증하는 것이 아닙니다. 자세한 내용은 이용 약관을 참조하세요.
오픈 소스 스크립트
트레이딩뷰의 진정한 정신에 따라, 이 스크립트의 작성자는 이를 오픈소스로 공개하여 트레이더들이 기능을 검토하고 검증할 수 있도록 했습니다. 작성자에게 찬사를 보냅니다! 이 코드는 무료로 사용할 수 있지만, 코드를 재게시하는 경우 하우스 룰이 적용된다는 점을 기억하세요.
면책사항
해당 정보와 게시물은 금융, 투자, 트레이딩 또는 기타 유형의 조언이나 권장 사항으로 간주되지 않으며, 트레이딩뷰에서 제공하거나 보증하는 것이 아닙니다. 자세한 내용은 이용 약관을 참조하세요.