OPEN-SOURCE SCRIPT
업데이트됨 80/20 Rule Indicator
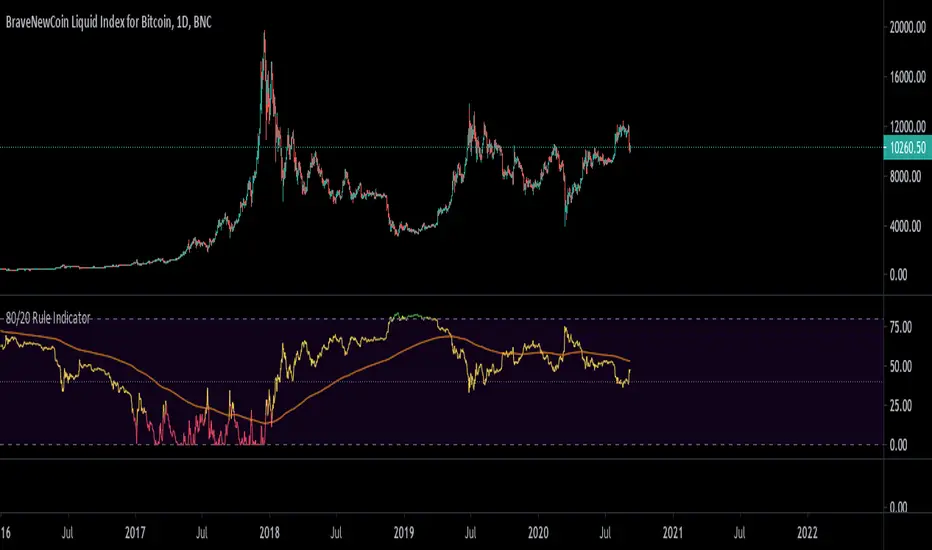
If you have not heard of the 80/20 rule then you are probably living under a rock =).
I took this idea and applied it to total loss percentage from the last known high. As it turns out, after about 80 percent losses on an asset it almost 'always' recovers. Perhaps the theory on this being that 20 percent will just hold on for dear life and never sell =).
For assets that are more established they tend to hit the midline around 40% as good buy zones, like APPL for example, but even APPL (Apple Inc.) in it's infant years hit 80 percent at times and they were always good buy zones. You can see something similar with BTC (Bitcoin) as well.
With the possibility of an upcoming crash in the years ahead you can use this indicator for the asset you are exploring to know with confidence you are buying at a good price zone.
This indicator is obviously meant for long term trading (daily chart or higher). You can use this to look for patterns for how long all-time high's last as well as an idea of when to sell out as well. This gives you a really good overall picture of the asset and it's current position in the price action and where it might be headed.
릴리즈 노트
Added color changes for when particular zones are met.릴리즈 노트
Added a simple EMA that can be used to trade on crossovers and crossunders.오픈 소스 스크립트
트레이딩뷰의 진정한 정신에 따라, 이 스크립트의 작성자는 이를 오픈소스로 공개하여 트레이더들이 기능을 검토하고 검증할 수 있도록 했습니다. 작성자에게 찬사를 보냅니다! 이 코드는 무료로 사용할 수 있지만, 코드를 재게시하는 경우 하우스 룰이 적용된다는 점을 기억하세요.
-=Gentleman Goat=- Download the TradingView Input Optimizer at tradingtools.software/optimizer
Discord: discord.gg/pGHHRczpbu
Discord: discord.gg/pGHHRczpbu
면책사항
해당 정보와 게시물은 금융, 투자, 트레이딩 또는 기타 유형의 조언이나 권장 사항으로 간주되지 않으며, 트레이딩뷰에서 제공하거나 보증하는 것이 아닙니다. 자세한 내용은 이용 약관을 참조하세요.
오픈 소스 스크립트
트레이딩뷰의 진정한 정신에 따라, 이 스크립트의 작성자는 이를 오픈소스로 공개하여 트레이더들이 기능을 검토하고 검증할 수 있도록 했습니다. 작성자에게 찬사를 보냅니다! 이 코드는 무료로 사용할 수 있지만, 코드를 재게시하는 경우 하우스 룰이 적용된다는 점을 기억하세요.
-=Gentleman Goat=- Download the TradingView Input Optimizer at tradingtools.software/optimizer
Discord: discord.gg/pGHHRczpbu
Discord: discord.gg/pGHHRczpbu
면책사항
해당 정보와 게시물은 금융, 투자, 트레이딩 또는 기타 유형의 조언이나 권장 사항으로 간주되지 않으며, 트레이딩뷰에서 제공하거나 보증하는 것이 아닙니다. 자세한 내용은 이용 약관을 참조하세요.