INVITE-ONLY SCRIPT
Opening Range Intraday Indicator
Opening Range Intraday Indicator
Summary
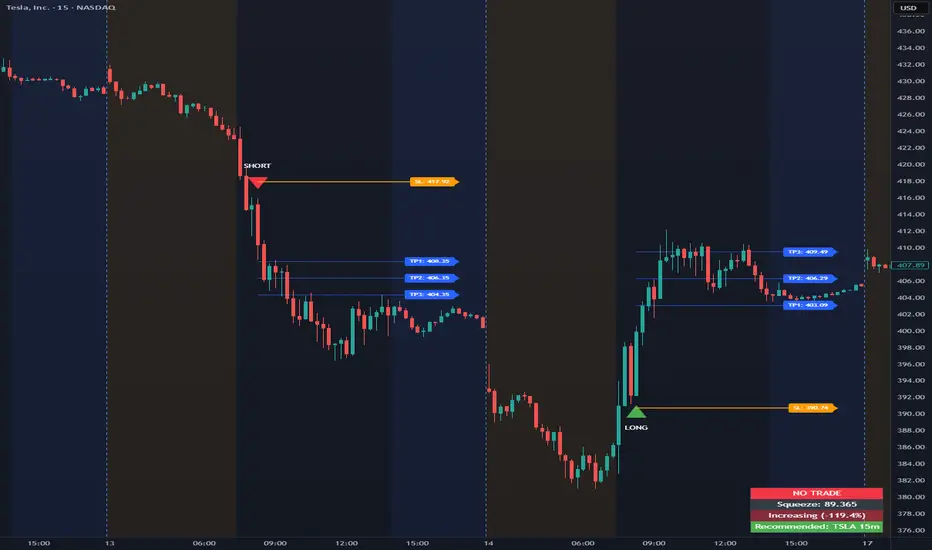
The Opening Range Intraday Indicator is a decision-support tool for intraday breakout entries. It combines an Opening Range Breakout (ORB) model with relative volume confirmation and a squeeze-style trend filter, then visualizes entries with clearly defined take-profit (TP) and stop-loss (SL) levels.
The indicator works on any ticker and any timeframe. However, its default parameters and internal logic are optimized for TSLA on the 15-minute chart, which is shown as a recommended context in the on-chart table for informational purposes only.
Core Logic
Opening Range Breakout
Establishes an opening range during the early session and monitors for confirmed breakouts above or below that range to generate potential intraday entries.
Relative Volume confirmation
Breakouts are validated using relative volume to help ensure participation and reduce low-quality signals during thin or inactive periods.
Squeeze / trend filter
A squeeze-style metric evaluates recent compression and directional behavior, helping to avoid entries during unfavorable or low-quality structural conditions.
Entry Visualization & Risk Levels
When a valid entry is confirmed, the indicator automatically:
Plots directional entry markers
Calculates and draws multiple take-profit levels
Draws a stop-loss level based on opening-range structure or ATR logic
Marks TP or SL hits directly on the chart for visual review
These visuals persist on the chart to allow traders to manually review trade structure and outcome over time.
On-Chart Table & Context Guidance
The indicator includes a compact on-chart table that displays:
Current squeeze value and short-term trend behavior
“No trade” conditions when structure is unfavorable
A recommended context message indicating whether the chart matches the optimized setup (TSLA on the 15-minute timeframe)
This message is informational only and does not restrict signals or functionality on other symbols or timeframes.
Flexibility & Controls
Users can customize:
Take-profit and stop-loss display behavior
Tight or standard stop-loss logic
Quiet windows near session close to suppress alerts
Visual settings and table positioning
This allows the indicator to be adapted to different instruments, volatility profiles, and execution styles.
Important Notes
This indicator does not execute trades and does not include automated backtesting or performance statistics.
TP/SL markers are visual aids only and are intended for manual review, not statistical validation.
Results will vary by symbol, timeframe, execution, and market conditions.
This indicator is intended as a research and decision-support tool for experienced intraday traders who understand execution risk, volatility, and position sizing. It should be used alongside proper risk management and independent analysis.
Summary
The Opening Range Intraday Indicator is a decision-support tool for intraday breakout entries. It combines an Opening Range Breakout (ORB) model with relative volume confirmation and a squeeze-style trend filter, then visualizes entries with clearly defined take-profit (TP) and stop-loss (SL) levels.
The indicator works on any ticker and any timeframe. However, its default parameters and internal logic are optimized for TSLA on the 15-minute chart, which is shown as a recommended context in the on-chart table for informational purposes only.
Core Logic
Opening Range Breakout
Establishes an opening range during the early session and monitors for confirmed breakouts above or below that range to generate potential intraday entries.
Relative Volume confirmation
Breakouts are validated using relative volume to help ensure participation and reduce low-quality signals during thin or inactive periods.
Squeeze / trend filter
A squeeze-style metric evaluates recent compression and directional behavior, helping to avoid entries during unfavorable or low-quality structural conditions.
Entry Visualization & Risk Levels
When a valid entry is confirmed, the indicator automatically:
Plots directional entry markers
Calculates and draws multiple take-profit levels
Draws a stop-loss level based on opening-range structure or ATR logic
Marks TP or SL hits directly on the chart for visual review
These visuals persist on the chart to allow traders to manually review trade structure and outcome over time.
On-Chart Table & Context Guidance
The indicator includes a compact on-chart table that displays:
Current squeeze value and short-term trend behavior
“No trade” conditions when structure is unfavorable
A recommended context message indicating whether the chart matches the optimized setup (TSLA on the 15-minute timeframe)
This message is informational only and does not restrict signals or functionality on other symbols or timeframes.
Flexibility & Controls
Users can customize:
Take-profit and stop-loss display behavior
Tight or standard stop-loss logic
Quiet windows near session close to suppress alerts
Visual settings and table positioning
This allows the indicator to be adapted to different instruments, volatility profiles, and execution styles.
Important Notes
This indicator does not execute trades and does not include automated backtesting or performance statistics.
TP/SL markers are visual aids only and are intended for manual review, not statistical validation.
Results will vary by symbol, timeframe, execution, and market conditions.
This indicator is intended as a research and decision-support tool for experienced intraday traders who understand execution risk, volatility, and position sizing. It should be used alongside proper risk management and independent analysis.
초대 전용 스크립트
이 스크립트는 작성자가 승인한 사용자만 접근할 수 있습니다. 사용하려면 요청 후 승인을 받아야 하며, 일반적으로 결제 후에 허가가 부여됩니다. 자세한 내용은 아래 작성자의 안내를 따르거나 T_I_M_E에게 직접 문의하세요.
트레이딩뷰는 스크립트의 작동 방식을 충분히 이해하고 작성자를 완전히 신뢰하지 않는 이상, 해당 스크립트에 비용을 지불하거나 사용하는 것을 권장하지 않습니다. 커뮤니티 스크립트에서 무료 오픈소스 대안을 찾아보실 수도 있습니다.
작성자 지시 사항
For access to the indicator, please visit https://whop.com/t-i-m-e-indicators To watch how to use this and other indicators, please visit http://www.youtube.com/@T.I.M.E_Indicators
면책사항
해당 정보와 게시물은 금융, 투자, 트레이딩 또는 기타 유형의 조언이나 권장 사항으로 간주되지 않으며, 트레이딩뷰에서 제공하거나 보증하는 것이 아닙니다. 자세한 내용은 이용 약관을 참조하세요.