OPEN-SOURCE SCRIPT
Prometheus Volatility Stop
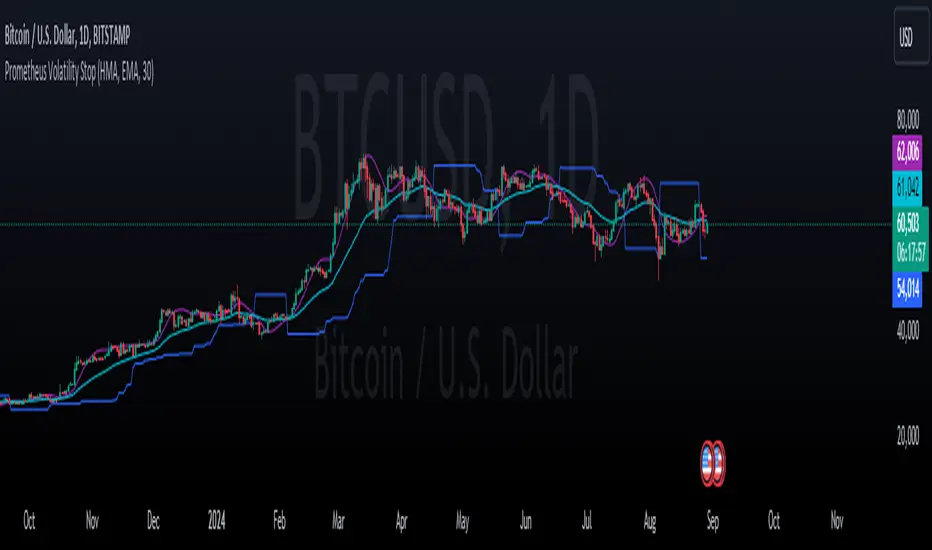
The Prometheus Volatility Stop is an indicator designed to give you a moving risk metric along with a custom Moving Average cross. After a calculation of the annualized volatility for the specified lookback period we determine bullish or bearish from the moving averages and plot the Volatility Stop accordingly.
User Input:
A user can select from Hull Moving Average, Exponential Moving average, Simple Moving Average, the Moving Average used in RSI, and Weighted Moving Average. The default is Hull Moving Average and Exponential Moving average.
A user can also specify the lookback period. The default is 30.
A user may also turn off the plots for the Moving Averages.
The reason for this approach is to be more original from the traditional Volatility Stop.
Calculation:
The Historical Volatility is calculated by taking the standard deviation of the log returns for the specified period and then annualizing it.
Pine Script®
Then the Volatility Stop is calculated as follows:
Pine Script®
When the second selected moving average is greater than the first, which signals bearishness, the historical volatility gets added to the high of that period. When the moving averages signal bullish the historical volatility gets subtracted from the low of that period.
Here is an example on ARM :
ARM :

After the first crossover, bullish signal, price runs for some time. As we get higher and higher so does the Volatility Stop. At the highs before a bearish crossover the price hits and closes at the Volatility Stop. Providing what could be an exit from a strong run up.
Intra-day example on QQQ :
QQQ :

We see that in the early bearish move price goes on to hit the Volatility Stop before the trend switches.
We also see that in the failed long. The price action throughout the rest of the day, while not providing in profit stop outs, do provide fine directional alerts.
All those examples have been done with the default settings. Upon changing Moving Average One to a WMA and Moving Average Two to an SMA, as well as the lookback to 75. We see this quickly can become a simple trend follower.

This is the perspective we aim to provide. We encourage traders to not follow indicators blindly. No indicator is 100% accurate. This one can give you a different perspective of price strength with volatility. We encourage any comments about desired updates or criticism!
User Input:
A user can select from Hull Moving Average, Exponential Moving average, Simple Moving Average, the Moving Average used in RSI, and Weighted Moving Average. The default is Hull Moving Average and Exponential Moving average.
A user can also specify the lookback period. The default is 30.
A user may also turn off the plots for the Moving Averages.
The reason for this approach is to be more original from the traditional Volatility Stop.
Calculation:
The Historical Volatility is calculated by taking the standard deviation of the log returns for the specified period and then annualizing it.
hv = ta.stdev(math.log(close / close[1]), lkb) * math.sqrt(252/5)
Then the Volatility Stop is calculated as follows:
recent_max = ta.highest(close, lkb)
recent_min = ta.lowest(close, lkb)
hv_stop = ma_2 > ma_1 ? recent_max + hv : recent_min - hv
When the second selected moving average is greater than the first, which signals bearishness, the historical volatility gets added to the high of that period. When the moving averages signal bullish the historical volatility gets subtracted from the low of that period.
Here is an example on
After the first crossover, bullish signal, price runs for some time. As we get higher and higher so does the Volatility Stop. At the highs before a bearish crossover the price hits and closes at the Volatility Stop. Providing what could be an exit from a strong run up.
Intra-day example on
We see that in the early bearish move price goes on to hit the Volatility Stop before the trend switches.
We also see that in the failed long. The price action throughout the rest of the day, while not providing in profit stop outs, do provide fine directional alerts.
All those examples have been done with the default settings. Upon changing Moving Average One to a WMA and Moving Average Two to an SMA, as well as the lookback to 75. We see this quickly can become a simple trend follower.
This is the perspective we aim to provide. We encourage traders to not follow indicators blindly. No indicator is 100% accurate. This one can give you a different perspective of price strength with volatility. We encourage any comments about desired updates or criticism!
오픈 소스 스크립트
트레이딩뷰의 진정한 정신에 따라, 이 스크립트의 작성자는 이를 오픈소스로 공개하여 트레이더들이 기능을 검토하고 검증할 수 있도록 했습니다. 작성자에게 찬사를 보냅니다! 이 코드는 무료로 사용할 수 있지만, 코드를 재게시하는 경우 하우스 룰이 적용된다는 점을 기억하세요.
면책사항
해당 정보와 게시물은 금융, 투자, 트레이딩 또는 기타 유형의 조언이나 권장 사항으로 간주되지 않으며, 트레이딩뷰에서 제공하거나 보증하는 것이 아닙니다. 자세한 내용은 이용 약관을 참조하세요.
오픈 소스 스크립트
트레이딩뷰의 진정한 정신에 따라, 이 스크립트의 작성자는 이를 오픈소스로 공개하여 트레이더들이 기능을 검토하고 검증할 수 있도록 했습니다. 작성자에게 찬사를 보냅니다! 이 코드는 무료로 사용할 수 있지만, 코드를 재게시하는 경우 하우스 룰이 적용된다는 점을 기억하세요.
면책사항
해당 정보와 게시물은 금융, 투자, 트레이딩 또는 기타 유형의 조언이나 권장 사항으로 간주되지 않으며, 트레이딩뷰에서 제공하거나 보증하는 것이 아닙니다. 자세한 내용은 이용 약관을 참조하세요.