PROTECTED SOURCE SCRIPT
업데이트됨 Gann Cycle Indicator
Version "Beta 1.0.0"
The "Gann Cycle Indicator" helps you analyze market cycles, from the smaller ones to the bigger ones. It requires you to know how Gann used market cycles to trade efficently. It helps predict where to expect a minum or a maximum and where to expect the start of a new cycle. It works with any market and can be set up as you prefer. It takes some inputs to work properly:
1) Starting X: this is the offset on the X axis where all the cycles start from. Once you applied this indicator on your graph, you must adjust the starting position to match the start of the cycle you found on the graph.
2) Cycles (1 to 4). These are the period, expressed in candles number, of each cycles. "Cycle 1" (i.e 3,25 days) should be the smaller of the 4 while "Cycle 4" the bigger one (i.e 15 days).
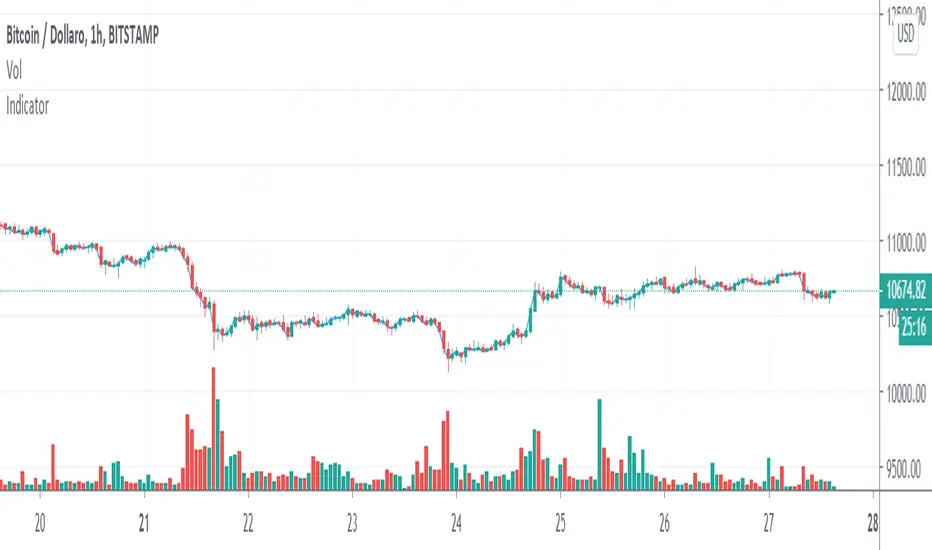
In this example, we trade BTCUSD on the 15 days cycle, so 15 days on the graph is composed of 360 candles. Our bigger cycle (Cycle 4) take 360 as period. For simplicity, "Cycle 3 to 1" take each time half of the period so: Cycle 3 -> 180, Cycle 2-> 90, Cycle 1 (smaller) -> 45.
3) Trend. 0 to a rectangle trend, -1 for bearish trend and 1 for a bullish trend .
4) Trend strength. From 0 to 2, step 0.1
This parameter expresses the strength of the trend. In a bullish market (Trend set to 1) you can set Trend strength from 0 to 2 to allow the indicator to follow the current market trend
Note:
This indicator must be put in a separate Y axis so it can overaly the graph.
The "Gann Cycle Indicator" helps you analyze market cycles, from the smaller ones to the bigger ones. It requires you to know how Gann used market cycles to trade efficently. It helps predict where to expect a minum or a maximum and where to expect the start of a new cycle. It works with any market and can be set up as you prefer. It takes some inputs to work properly:
1) Starting X: this is the offset on the X axis where all the cycles start from. Once you applied this indicator on your graph, you must adjust the starting position to match the start of the cycle you found on the graph.
2) Cycles (1 to 4). These are the period, expressed in candles number, of each cycles. "Cycle 1" (i.e 3,25 days) should be the smaller of the 4 while "Cycle 4" the bigger one (i.e 15 days).
In this example, we trade BTCUSD on the 15 days cycle, so 15 days on the graph is composed of 360 candles. Our bigger cycle (Cycle 4) take 360 as period. For simplicity, "Cycle 3 to 1" take each time half of the period so: Cycle 3 -> 180, Cycle 2-> 90, Cycle 1 (smaller) -> 45.
3) Trend. 0 to a rectangle trend, -1 for bearish trend and 1 for a bullish trend .
4) Trend strength. From 0 to 2, step 0.1
This parameter expresses the strength of the trend. In a bullish market (Trend set to 1) you can set Trend strength from 0 to 2 to allow the indicator to follow the current market trend
Note:
This indicator must be put in a separate Y axis so it can overaly the graph.
릴리즈 노트
Version "Beta 1.0.0"The "Cycle Indicator" helps you analyze market cycles, from the smaller ones to the bigger ones. It requires you to know how market cycles work,to trade efficently. It helps predict where to expect a minum or a maximum and where to expect the start of a new cycle. It works with any market and can be set up as you prefer. It takes some inputs to work properly:
1) Starting X: this is the offset on the X axis where all the cycles start from. Once you applied this indicator on your graph, you must adjust the starting position to match the start of the cycle you found on the graph.
2) Cycles (1 to 4). These are the period, expressed in candles number, of each cycles. "Cycle 1" (i.e 3,25 days) should be the smaller of the 4 while "Cycle 4" the bigger one (i.e 15 days).
In this example, we trade BTCUSD on the 15 days cycle, so 15 days on the graph is composed of 360 candles. Our bigger cycle (Cycle 4) take 360 as period. For simplicity, "Cycle 3 to 1" take each time half of the period so: Cycle 3 -> 180, Cycle 2-> 90, Cycle 1 (smaller) -> 45.
3) Trend. 0 to a rectangle trend, -1 for bearish trend and 1 for a bullish trend .
4) Trend strength. From 0 to 2, step 0.1
This parameter expresses the strength of the trend. In a bullish market (Trend set to 1) you can set Trend strength from 0 to 2 to allow the indicator to follow the current market trend
Note:
This indicator must be put in a separate Y axis so it can overaly the graph.
릴리즈 노트
-보호된 스크립트입니다
이 스크립트는 비공개 소스로 게시됩니다. 하지만 이를 자유롭게 제한 없이 사용할 수 있습니다 – 자세한 내용은 여기에서 확인하세요.
면책사항
해당 정보와 게시물은 금융, 투자, 트레이딩 또는 기타 유형의 조언이나 권장 사항으로 간주되지 않으며, 트레이딩뷰에서 제공하거나 보증하는 것이 아닙니다. 자세한 내용은 이용 약관을 참조하세요.
보호된 스크립트입니다
이 스크립트는 비공개 소스로 게시됩니다. 하지만 이를 자유롭게 제한 없이 사용할 수 있습니다 – 자세한 내용은 여기에서 확인하세요.
면책사항
해당 정보와 게시물은 금융, 투자, 트레이딩 또는 기타 유형의 조언이나 권장 사항으로 간주되지 않으며, 트레이딩뷰에서 제공하거나 보증하는 것이 아닙니다. 자세한 내용은 이용 약관을 참조하세요.