OPEN-SOURCE SCRIPT
RSI Multi Time Frame - Spot Panic Sell Moments and profit!
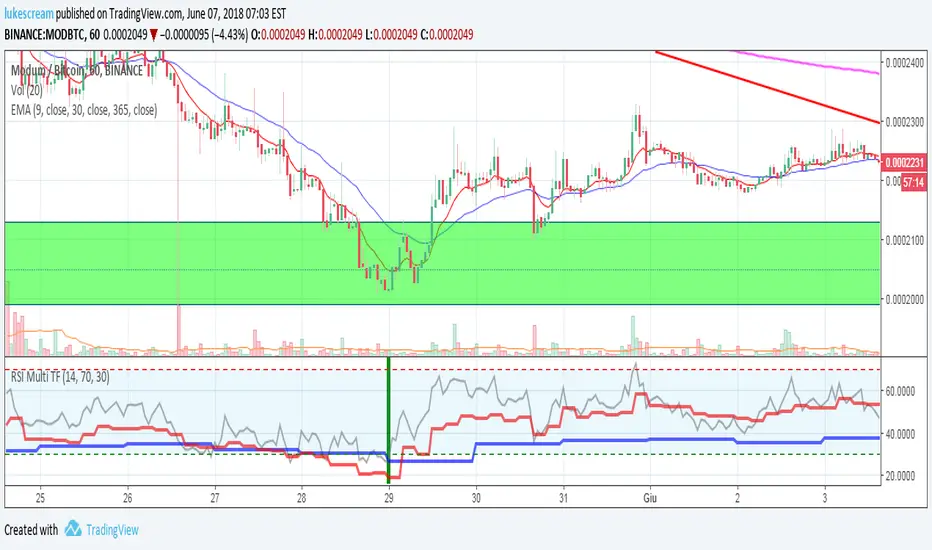
Union of three RSI indicators: 1h, 4h and daily. In order to show 1h RSI, you have to set it as active time frame on the chart.
Purpose: spot "triple oversold" moments, where all the three RSI are under the threshold, which is 30 by default but editable.
Target Market: Cryptocurrencies. Didn't try it on other ones, may work as well. Fits Crypto well as, by experience, I can tell it usually doesn't stay oversold for long.
When the market panics and triple oversold occurs, the spot is highlighted by a green vertical bar on the indicator.
The indicator highlights triple overbought conditions as well (usually indicating strong FOMO), but I usually don't use it as a signal.
I suggest to edit the oversold threshold in order to make it fit the coin you're studying, minimizing false positives.
Special thanks to Heavy91, a Discord user, for inspiring me in this indicator.
Any editing proposal is welcome!
I reposted this script, as the first time I wrote it in Italian. Sorry for that.
오픈 소스 스크립트
트레이딩뷰의 진정한 정신에 따라, 이 스크립트의 작성자는 이를 오픈소스로 공개하여 트레이더들이 기능을 검토하고 검증할 수 있도록 했습니다. 작성자에게 찬사를 보냅니다! 이 코드는 무료로 사용할 수 있지만, 코드를 재게시하는 경우 하우스 룰이 적용된다는 점을 기억하세요.
면책사항
해당 정보와 게시물은 금융, 투자, 트레이딩 또는 기타 유형의 조언이나 권장 사항으로 간주되지 않으며, 트레이딩뷰에서 제공하거나 보증하는 것이 아닙니다. 자세한 내용은 이용 약관을 참조하세요.
오픈 소스 스크립트
트레이딩뷰의 진정한 정신에 따라, 이 스크립트의 작성자는 이를 오픈소스로 공개하여 트레이더들이 기능을 검토하고 검증할 수 있도록 했습니다. 작성자에게 찬사를 보냅니다! 이 코드는 무료로 사용할 수 있지만, 코드를 재게시하는 경우 하우스 룰이 적용된다는 점을 기억하세요.
면책사항
해당 정보와 게시물은 금융, 투자, 트레이딩 또는 기타 유형의 조언이나 권장 사항으로 간주되지 않으며, 트레이딩뷰에서 제공하거나 보증하는 것이 아닙니다. 자세한 내용은 이용 약관을 참조하세요.