PROTECTED SOURCE SCRIPT
업데이트됨 Trading Signals
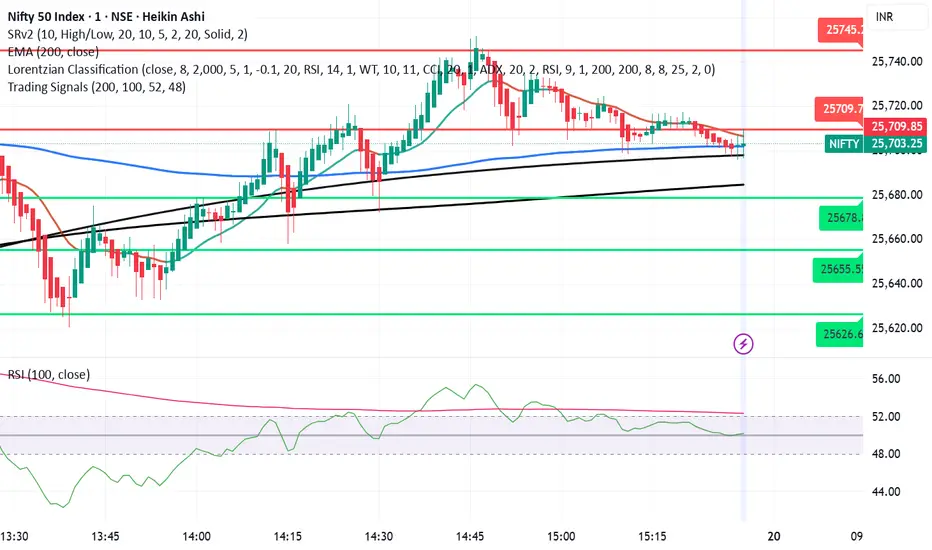
This script is designed to help identify high-probability trend reversal and continuation signals by combining moving average crossovers with momentum confirmation.
✨ How It Works:
EMA 200 — plots the 200-period Exponential Moving Average (EMA) of the closing price.
EMA-based SMA 200 — applies a 200-period Simple Moving Average (SMA) on top of the EMA values for smoother trend tracking.
Relative Strength Index (RSI) (Length 100) is used as a momentum filter to avoid false signals.
🟢 Buy Signal Conditions:
EMA 200 crosses above the EMA-based SMA 200.
RSI (100) is greater than 52, confirming bullish momentum.
🔴 Sell Signal Conditions:
EMA 200 crosses below the EMA-based SMA 200.
RSI (100) is less than 48, confirming bearish momentum.
릴리즈 노트
This script is designed to help identify high-probability trend reversal and continuation signals by combining moving average crossovers with momentum confirmation.✨ How It Works:
EMA 200 — plots the 200-period Exponential Moving Average (EMA) of the closing price.
EMA-based SMA 200 — applies a 200-period Simple Moving Average (SMA) on top of the EMA values for smoother trend tracking.
Relative Strength Index (RSI) (Length 100) is used as a momentum filter to avoid false signals.
🟢 Buy Signal Conditions:
EMA 200 crosses above the EMA-based SMA 200.
🔴 Sell Signal Conditions:
EMA 200 crosses below the EMA-based SMA 200.
보호된 스크립트입니다
이 스크립트는 비공개 소스로 게시됩니다. 하지만 이를 자유롭게 제한 없이 사용할 수 있습니다 – 자세한 내용은 여기에서 확인하세요.
면책사항
해당 정보와 게시물은 금융, 투자, 트레이딩 또는 기타 유형의 조언이나 권장 사항으로 간주되지 않으며, 트레이딩뷰에서 제공하거나 보증하는 것이 아닙니다. 자세한 내용은 이용 약관을 참조하세요.
보호된 스크립트입니다
이 스크립트는 비공개 소스로 게시됩니다. 하지만 이를 자유롭게 제한 없이 사용할 수 있습니다 – 자세한 내용은 여기에서 확인하세요.
면책사항
해당 정보와 게시물은 금융, 투자, 트레이딩 또는 기타 유형의 조언이나 권장 사항으로 간주되지 않으며, 트레이딩뷰에서 제공하거나 보증하는 것이 아닙니다. 자세한 내용은 이용 약관을 참조하세요.