OPEN-SOURCE SCRIPT
Market State Indicator with Precise ADF
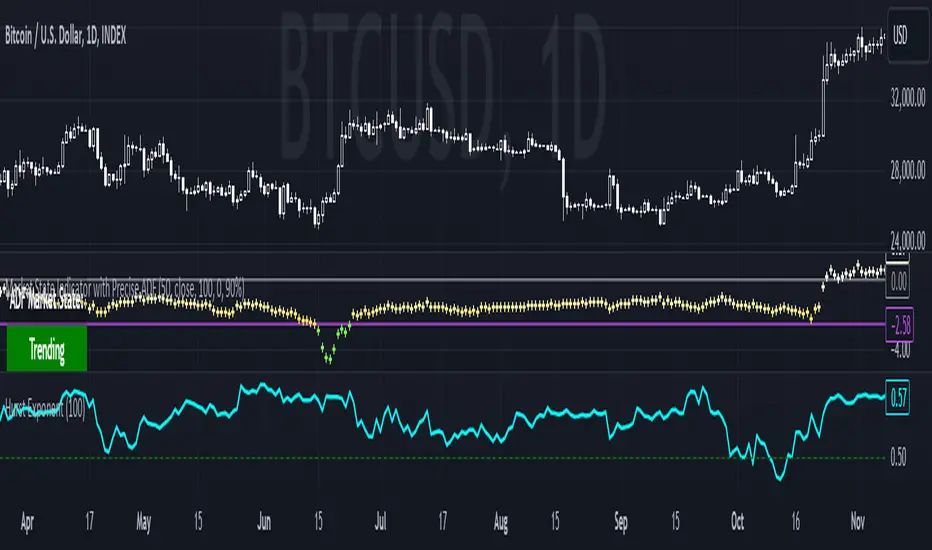
This script combines the Hurst Exponent and Augmented Dickey-Fuller (ADF) Test to help traders identify market states—whether the market is trending, mean-reverting, or in a random walk. By analyzing both statistical tools together, traders can gain deeper insights into the underlying market dynamics, allowing them to make more informed decisions.
Code Explanation:
Hurst Exponent Calculation:
The script calculates the Hurst Exponent over a customizable length. A Hurst value above 0.5 suggests a trending market, below 0.5 indicates a mean-reverting market, and around 0.5 suggests a random walk. The Hurst Exponent is plotted as a cyan line with a green threshold line at 0.5.
Augmented Dickey-Fuller (ADF) Test Implementation:
The ADF test is a statistical test used to determine if a time series is stationary (mean-reverting) or non-stationary (trending). The script calculates the ADF test statistic (tauADF) and compares it to a critical value (crit) based on the chosen confidence level (90%, 95%, 99%). If the test statistic is below the critical value, it suggests mean-reversion (green cross); above the critical value suggests trending (red cross).
The ADF result is plotted as a cross with color indicating its state: green for mean-reverting, red for trending, and white/yellow gradients for in-between states.
Market State Detection:
The script determines the market state by comparing the Hurst Exponent and ADF Test results. If both suggest trending, the market is likely in a strong trend. If both suggest mean-reversion, the market is likely mean-reverting. When the indicators are close to the critical thresholds (purple for mean-reversion, grey for trending), the market exhibits characteristics of those states, even if it doesn’t definitively cross the threshold.
If the readings are somewhere in the middle, the market might be in a random walk state, lacking a clear trend or mean-reversion.
Visualization:
The script provides an option to display the market state as boxes on the chart. The Hurst Market State Box indicates whether the Hurst Exponent suggests a trending or mean-reverting market, while the ADF Market State Box shows the same for the ADF test. Green indicates a mean-reverting market, and red indicates trending.
Use Case: This script is designed to be a powerful confluence tool, combining the Hurst Exponent and ADF Test to give traders a robust analysis of market conditions. While the script may not always provide a definitive market state, the proximity of the ADF statistic to its critical value and the Hurst Exponent's indication help traders gauge the likelihood of trending, mean-reverting, or random walk behavior, aiding in better decision-making.
By using this tool, traders can quantitatively assess market conditions and adjust their strategies accordingly, whether they favor trend-following, mean-reversion, or need to be cautious during random walk phases.
오픈 소스 스크립트
트레이딩뷰의 진정한 정신에 따라, 이 스크립트의 작성자는 이를 오픈소스로 공개하여 트레이더들이 기능을 검토하고 검증할 수 있도록 했습니다. 작성자에게 찬사를 보냅니다! 이 코드는 무료로 사용할 수 있지만, 코드를 재게시하는 경우 하우스 룰이 적용된다는 점을 기억하세요.
면책사항
해당 정보와 게시물은 금융, 투자, 트레이딩 또는 기타 유형의 조언이나 권장 사항으로 간주되지 않으며, 트레이딩뷰에서 제공하거나 보증하는 것이 아닙니다. 자세한 내용은 이용 약관을 참조하세요.
오픈 소스 스크립트
트레이딩뷰의 진정한 정신에 따라, 이 스크립트의 작성자는 이를 오픈소스로 공개하여 트레이더들이 기능을 검토하고 검증할 수 있도록 했습니다. 작성자에게 찬사를 보냅니다! 이 코드는 무료로 사용할 수 있지만, 코드를 재게시하는 경우 하우스 룰이 적용된다는 점을 기억하세요.
면책사항
해당 정보와 게시물은 금융, 투자, 트레이딩 또는 기타 유형의 조언이나 권장 사항으로 간주되지 않으며, 트레이딩뷰에서 제공하거나 보증하는 것이 아닙니다. 자세한 내용은 이용 약관을 참조하세요.