OPEN-SOURCE SCRIPT
업데이트됨 Heiken Ashi Lower Pane
Not one of my more challenging scripts, never the less I was requested to publish this open source indicator.
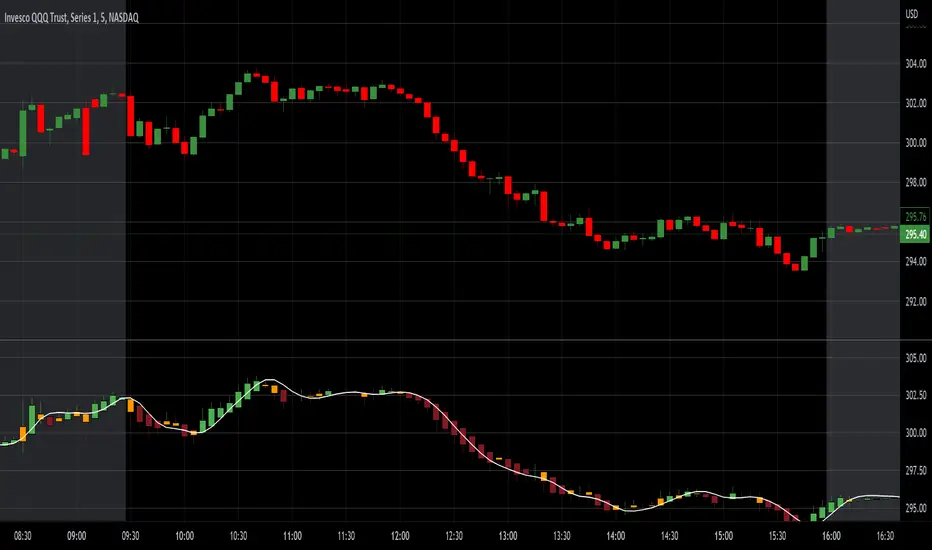
Heiken Ashi (HA) candles indicate strength usually when the candles have wicks in the direction of the movement, ie. top wicks on green candles w/NO wicks on bottom and vice versa for bearish behavior (bottom wicks on red candles). Weakness in the movement CAN be spotted by watching for wicks opposite the movement appearing.
This indicator can be used in a lower pane to show heiken ashi candles concurrently with above main chart regular candles.
Nothing special about it other than displaying bull/bear ha candles with a twist of third color candle (orange default) which is shown when HA candle gets a wick in opposite direction of movement which usually indicates potential directional weakness.
It also provides various moving average line types based upon the HA high, low, close, open values (HLC4) that can used if you are into watching for a cross over of the HA candle to a MA line.
Note: You can also display this over the main chart as an overlay just by selecting the three dots on the indicator and "Move to" option. Be advised doing so will probably cause too much overlapping onto the regular candles.
릴리즈 노트
Fixed Bugs regarding timeframes and added multi time frame options.오픈 소스 스크립트
트레이딩뷰의 진정한 정신에 따라, 이 스크립트의 작성자는 이를 오픈소스로 공개하여 트레이더들이 기능을 검토하고 검증할 수 있도록 했습니다. 작성자에게 찬사를 보냅니다! 이 코드는 무료로 사용할 수 있지만, 코드를 재게시하는 경우 하우스 룰이 적용된다는 점을 기억하세요.
면책사항
해당 정보와 게시물은 금융, 투자, 트레이딩 또는 기타 유형의 조언이나 권장 사항으로 간주되지 않으며, 트레이딩뷰에서 제공하거나 보증하는 것이 아닙니다. 자세한 내용은 이용 약관을 참조하세요.
오픈 소스 스크립트
트레이딩뷰의 진정한 정신에 따라, 이 스크립트의 작성자는 이를 오픈소스로 공개하여 트레이더들이 기능을 검토하고 검증할 수 있도록 했습니다. 작성자에게 찬사를 보냅니다! 이 코드는 무료로 사용할 수 있지만, 코드를 재게시하는 경우 하우스 룰이 적용된다는 점을 기억하세요.
면책사항
해당 정보와 게시물은 금융, 투자, 트레이딩 또는 기타 유형의 조언이나 권장 사항으로 간주되지 않으며, 트레이딩뷰에서 제공하거나 보증하는 것이 아닙니다. 자세한 내용은 이용 약관을 참조하세요.