INVITE-ONLY SCRIPT
업데이트됨 PSP Table [Pogiest]
General
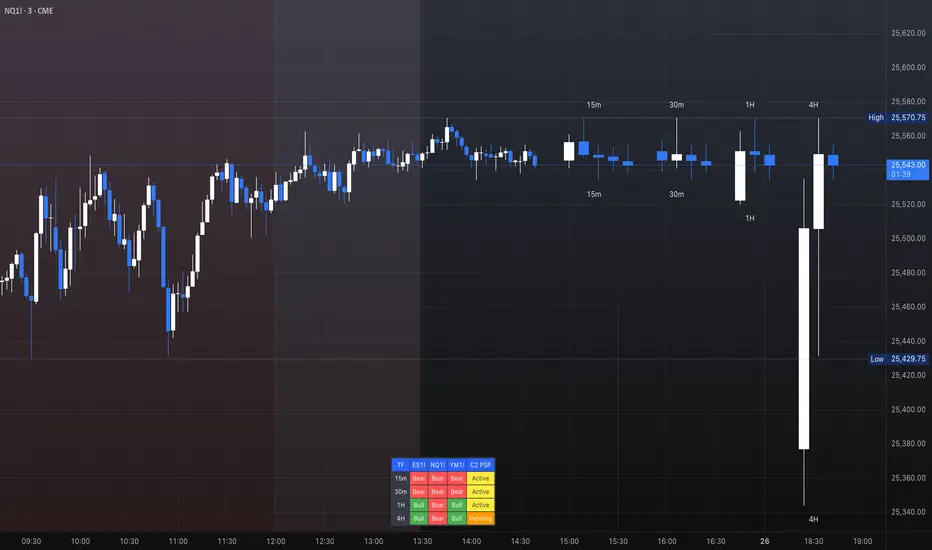
Precision Swing Point (PSP) is a concept derived from Quarterly Theory concepts originating from ICT methodologies. The concept typically uses a 3-candle swing formation in which candle 2 has a divergence in the closing price with one asset compared to the other two assets in a correlated asset triad (i.e. one closes bullish and two closes bearish, vice-versa). The indicator is designed to track PSPs in real time as they are forming.
Note: Credit of concepts/ideas goes to TraderDaye.
In the image above, the higher timeframe candle overlay is displayed on the chart to be shown as an example with the indicator (table). Higher timeframe candles are not included as part of the indicator. This indicator is only comprised of the table shown.
Timeframe Column:
1. Displays up to four different timeframes to monitor.
Asset Columns:
1. Cells display “Bull” or “Bear” showing the current state of each candle and updates in real-time tick by tick.
C2 PSP Column:
1. “Inactive” indicates no divergence in all assets (i.e. all three assets in a triad are all printing bullish or bearish candles)
2. “Pending” indicates a potential divergence in candle 2’s closing price (i.e. one asset’s current state in candle 2 is bearish while the others are bullish, vice versa). This updates in real-time tick by tick and continues to monitor each candle as they form for a candle 2 divergence.
3. “Active” indicates a confirmed candle 2 divergence.
Note: Any historical PSPs will not be displayed in the table as this indicator only tracks PSPs in real time and continuously monitors for potential PSPs and confirmed PSPs.
Settings
1. Choose up to three different assets to monitor.
Note: If only two are selected, the indicator will only display the two selected and compare the two assets for divergences. If one is selected, a warning sign will be displayed to select at least two assets.
2. Choose up to four different timeframes. Option to deselect timeframes.
3. Toggle option to show/hide the table.
4. Adjust the table positioning to be displayed on the chart.
6. Option to change text size in the table cells. This will also increase/decrease the size of the table.
7. Table Color Customization gives you options to change the background colors of the cells including text color.
What makes this indicator unique:
1. Track current PSP status in real-time tick by tick as candles form in multiple timeframes.
2. Instead of switching through timeframes to check for PSPs, they are consolidated in one table.
Risk Disclaimer
This indicator is for educational and informational purposes only and does not constitute financial advice. All trading and investment decisions remain solely the responsibility of the user.
Trading involves a high degree of risk, and past performance is not indicative of future results.
Always conduct your own research and consult with a qualified financial professional before making any trading decisions.
By using this indicator, users acknowledge they understand these risks and accept full responsibility for their trading decisions and outcomes.
릴리즈 노트
Naming Correction.초대 전용 스크립트
이 스크립트는 작성자가 승인한 사용자만 접근할 수 있습니다. 사용하려면 요청을 보내고 승인을 받아야 합니다. 일반적으로 결제 후에 승인이 이루어집니다. 자세한 내용은 아래 작성자의 지침을 따르거나 Pogiest에게 직접 문의하세요.
트레이딩뷰는 스크립트 작성자를 완전히 신뢰하고 스크립트 작동 방식을 이해하지 않는 한 스크립트 비용을 지불하거나 사용하지 않는 것을 권장하지 않습니다. 무료 오픈소스 대체 스크립트는 커뮤니티 스크립트에서 찾을 수 있습니다.
작성자 지시 사항
To get access, please visit website: https://whop.com/pogiest-c457 or https://whop.com/pogiest-c457/precision-swing-point-table
For further questions regarding the functions of the indicator, feel free to message me directly here on TradingView. - Pogiest
면책사항
이 정보와 게시물은 TradingView에서 제공하거나 보증하는 금융, 투자, 거래 또는 기타 유형의 조언이나 권고 사항을 의미하거나 구성하지 않습니다. 자세한 내용은 이용 약관을 참고하세요.
초대 전용 스크립트
이 스크립트는 작성자가 승인한 사용자만 접근할 수 있습니다. 사용하려면 요청을 보내고 승인을 받아야 합니다. 일반적으로 결제 후에 승인이 이루어집니다. 자세한 내용은 아래 작성자의 지침을 따르거나 Pogiest에게 직접 문의하세요.
트레이딩뷰는 스크립트 작성자를 완전히 신뢰하고 스크립트 작동 방식을 이해하지 않는 한 스크립트 비용을 지불하거나 사용하지 않는 것을 권장하지 않습니다. 무료 오픈소스 대체 스크립트는 커뮤니티 스크립트에서 찾을 수 있습니다.
작성자 지시 사항
To get access, please visit website: https://whop.com/pogiest-c457 or https://whop.com/pogiest-c457/precision-swing-point-table
For further questions regarding the functions of the indicator, feel free to message me directly here on TradingView. - Pogiest
면책사항
이 정보와 게시물은 TradingView에서 제공하거나 보증하는 금융, 투자, 거래 또는 기타 유형의 조언이나 권고 사항을 의미하거나 구성하지 않습니다. 자세한 내용은 이용 약관을 참고하세요.