PROTECTED SOURCE SCRIPT
HMA High/Low Band - Trend Color
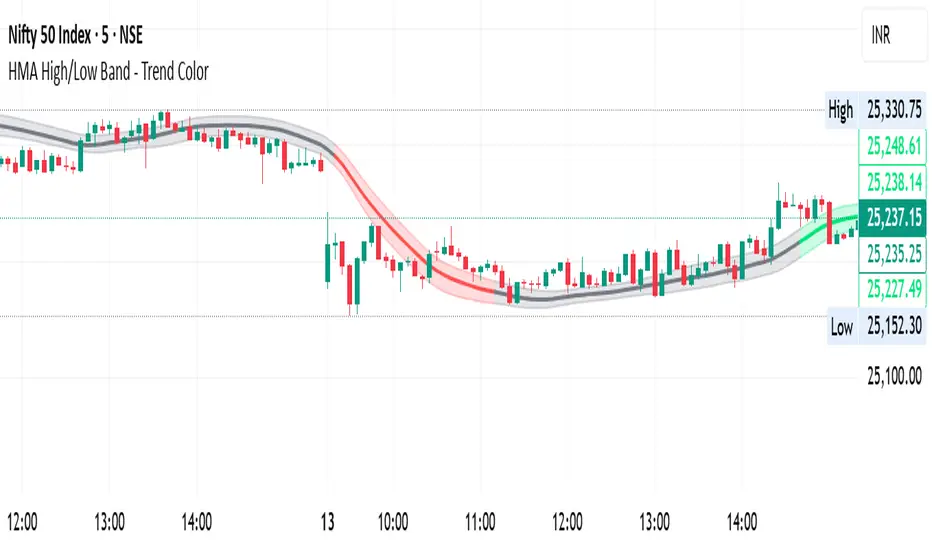
HMA High/Low Band Trend
Visualize market trends clearly with a single Hull Moving Average (HMA) and dynamic high/low bands. The indicator colors the HMA and its bands based on trend direction:
Green = Uptrend
Red = Downtrend
Gray = Sideways
The band adjusts dynamically to price action, giving a clear view of trending and sideways markets without cluttering your chart. Ideal for traders who want a smooth trend filter with instant visual cues.
보호된 스크립트입니다
이 스크립트는 비공개 소스로 게시됩니다. 하지만 제한 없이 자유롭게 사용할 수 있습니다 — 여기에서 자세히 알아보기.
면책사항
이 정보와 게시물은 TradingView에서 제공하거나 보증하는 금융, 투자, 거래 또는 기타 유형의 조언이나 권고 사항을 의미하거나 구성하지 않습니다. 자세한 내용은 이용 약관을 참고하세요.
보호된 스크립트입니다
이 스크립트는 비공개 소스로 게시됩니다. 하지만 제한 없이 자유롭게 사용할 수 있습니다 — 여기에서 자세히 알아보기.
면책사항
이 정보와 게시물은 TradingView에서 제공하거나 보증하는 금융, 투자, 거래 또는 기타 유형의 조언이나 권고 사항을 의미하거나 구성하지 않습니다. 자세한 내용은 이용 약관을 참고하세요.