OPEN-SOURCE SCRIPT
2x ATR Horizontal Rays
2x ATR Horizontal Rays Indicator
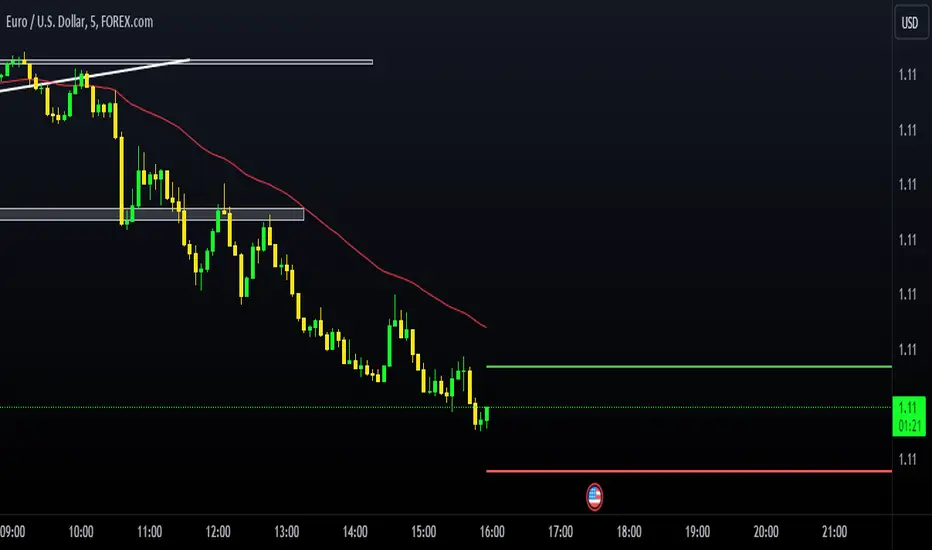
This script plots horizontal rays based on the 2x ATR (Average True Range) of the previous candle. It helps traders visualize key support and resistance levels by extending lines from the last candle's price, calculated with a 2x ATR multiplier. The indicator draws two lines:
Upper ATR Line: Positioned above the previous candle’s close by 2x the ATR value.
Lower ATR Line: Positioned below the previous candle’s close by 2x the ATR value.
Key Features:
Customizable ATR Length: Allows users to input their preferred ATR period to suit different market conditions.
Dynamic Horizontal Lines: The lines update with each new candle, giving traders a clear visual of volatility levels.
Extended Right Lines: The horizontal rays extend to the right, serving as potential zones for price reversals or breakouts.
This indicator is useful for traders looking to gauge market volatility and set target levels or stops based on historical price movements.
How to Use:
Add the indicator to your chart and adjust the ATR length in the settings.
Watch how the price interacts with the upper and lower ATR lines as potential zones for support, resistance, or trend continuation.
Happy trading!
오픈 소스 스크립트
트레이딩뷰의 진정한 정신에 따라, 이 스크립트의 작성자는 이를 오픈소스로 공개하여 트레이더들이 기능을 검토하고 검증할 수 있도록 했습니다. 작성자에게 찬사를 보냅니다! 이 코드는 무료로 사용할 수 있지만, 코드를 재게시하는 경우 하우스 룰이 적용된다는 점을 기억하세요.
면책사항
해당 정보와 게시물은 금융, 투자, 트레이딩 또는 기타 유형의 조언이나 권장 사항으로 간주되지 않으며, 트레이딩뷰에서 제공하거나 보증하는 것이 아닙니다. 자세한 내용은 이용 약관을 참조하세요.
오픈 소스 스크립트
트레이딩뷰의 진정한 정신에 따라, 이 스크립트의 작성자는 이를 오픈소스로 공개하여 트레이더들이 기능을 검토하고 검증할 수 있도록 했습니다. 작성자에게 찬사를 보냅니다! 이 코드는 무료로 사용할 수 있지만, 코드를 재게시하는 경우 하우스 룰이 적용된다는 점을 기억하세요.
면책사항
해당 정보와 게시물은 금융, 투자, 트레이딩 또는 기타 유형의 조언이나 권장 사항으로 간주되지 않으며, 트레이딩뷰에서 제공하거나 보증하는 것이 아닙니다. 자세한 내용은 이용 약관을 참조하세요.