OPEN-SOURCE SCRIPT
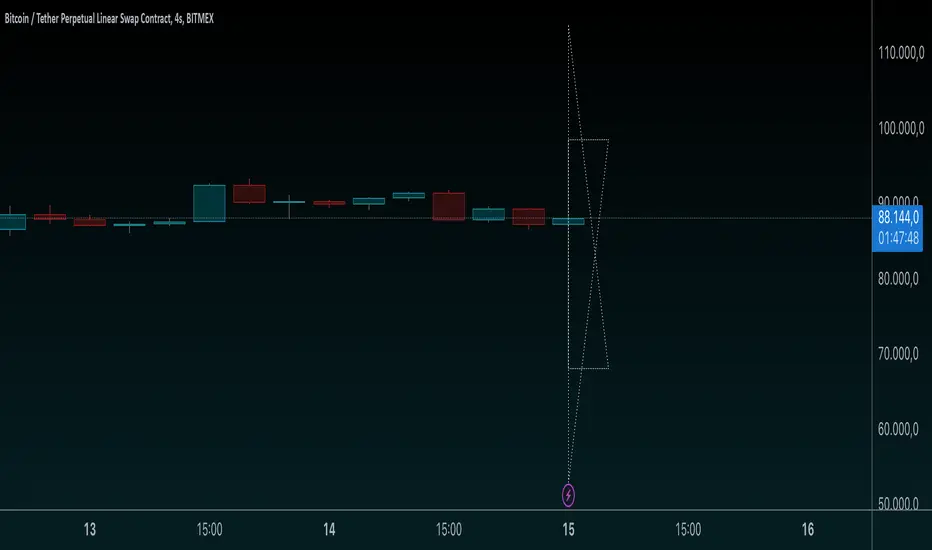
Star of David Drawing-AYNET

Explanation of Code
Settings:
centerTime defines the center time for the star pattern, defaulting to January 1, 2023.
centerPrice is the center Y-axis level for positioning the star.
size controls the overall size of the star.
starColor and lineWidth allow customization of the color and thickness of the lines.
Utility Function:
toRadians converts degrees to radians, though it’s not directly used here, it might be useful for future adjustments to angles.
Star of David Drawing Function:
The drawStarOfDavid function calculates the position of each point on the star relative to the center coordinates (centerTime, centerY) and size.
The pattern has six key points that form two overlapping triangles, creating the Star of David pattern.
The time offsets (offset1 and offset2) determine the horizontal spread of the star, scaling according to size.
The line.new function is used to draw the star lines with the calculated coordinates, casting timestamps to int to comply with line.new requirements.
Star Rendering:
Finally, drawStarOfDavid is called to render the Star of David pattern on the chart based on the input parameters.
This code draws the Star of David on a chart at a specified time and price level, with customizable size, color, and line width. Adjust centerTime, centerPrice, and size as needed for different star placements on the chart.
오픈 소스 스크립트
트레이딩뷰의 진정한 정신에 따라, 이 스크립트의 작성자는 이를 오픈소스로 공개하여 트레이더들이 기능을 검토하고 검증할 수 있도록 했습니다. 작성자에게 찬사를 보냅니다! 이 코드는 무료로 사용할 수 있지만, 코드를 재게시하는 경우 하우스 룰이 적용된다는 점을 기억하세요.
면책사항
해당 정보와 게시물은 금융, 투자, 트레이딩 또는 기타 유형의 조언이나 권장 사항으로 간주되지 않으며, 트레이딩뷰에서 제공하거나 보증하는 것이 아닙니다. 자세한 내용은 이용 약관을 참조하세요.
오픈 소스 스크립트
트레이딩뷰의 진정한 정신에 따라, 이 스크립트의 작성자는 이를 오픈소스로 공개하여 트레이더들이 기능을 검토하고 검증할 수 있도록 했습니다. 작성자에게 찬사를 보냅니다! 이 코드는 무료로 사용할 수 있지만, 코드를 재게시하는 경우 하우스 룰이 적용된다는 점을 기억하세요.
면책사항
해당 정보와 게시물은 금융, 투자, 트레이딩 또는 기타 유형의 조언이나 권장 사항으로 간주되지 않으며, 트레이딩뷰에서 제공하거나 보증하는 것이 아닙니다. 자세한 내용은 이용 약관을 참조하세요.